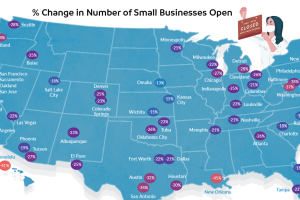
Across the U.S., 37% of small businesses are still shuttered. This map demonstrates how uneven that closure rate is in cities around the country. Read more
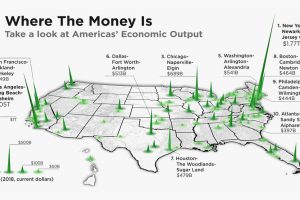
The total U.S. GDP stands at a whopping $21 trillion, but which metro areas contribute to the most in terms of economic output? Read more
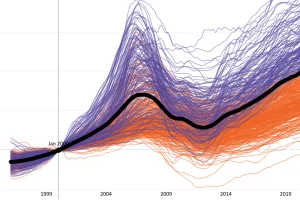
This interactive visualization tracks two decades of home price changes in hundreds of cities in the United States. Read more
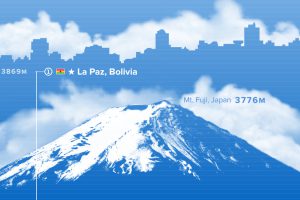
Where are the world’s highest cities? This graphic ranks the world’s major urban centers by altitude above sea level. Read more

Which cities have the most CCTV cameras? This map reveals the top surveillance cities worldwide in terms of the prevalence of CCTV cameras. Read more
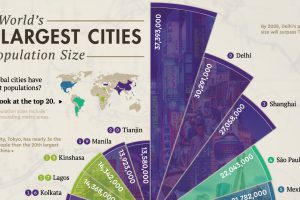
Where are the world’s largest cities in terms of population? This graphic looks at the top 20 most populous cities in the world. Read more
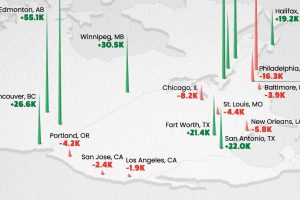
Toronto was the fastest-growing city in Canada and the U.S. in 2023, adding over 125,000 people to its population. Read more
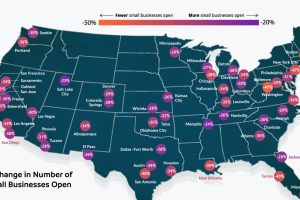
Compared to January 2020, 34% of small businesses are currently closed. This map looks at the small business recovery rate in 50 metro areas. Read more
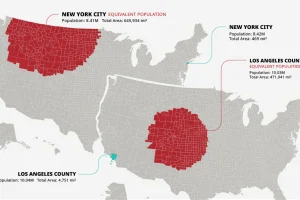
The U.S. population is spread across a huge amount of land, but its distribution is far from equal. These maps are a unique look at population density Read more
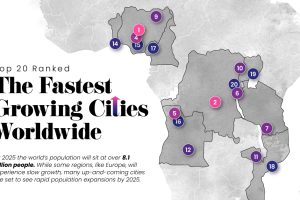
Nearly 60% of the world’s population lives in cities and this trend is not slowing down—take a look at the world’s 20 fastest growing cities. Read more

