

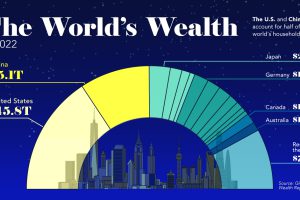
This visualization breaks down how household wealth is distributed around the world. Just 10 countries now account for 75% of total household wealth. Read more

Using our database of 500+ predictions from reports, articles, interviews, and more, we highlight what experts think will happen in 2023 Read more
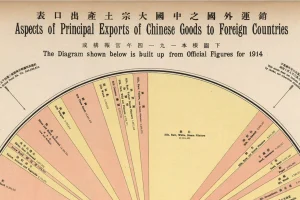
This pie chart, circa 1914, is a fascinating breakdown of China’s export economy just prior to World War I. Read more
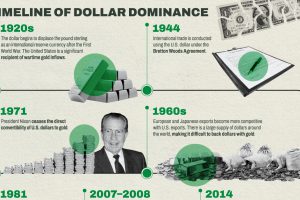
The U.S. dollar is the dominant currency in the global financial system, but some countries are following the trend of de-dollarization. Read more
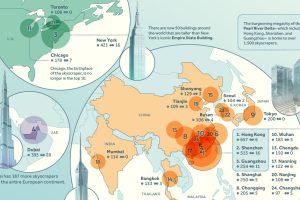
We rank the world’s leading cities with the most skyscrapers, highlighting China’s remarkable dominance in building vertically. Read more
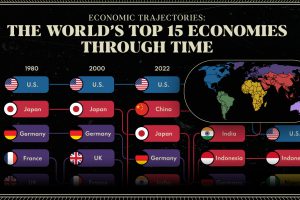
We provide a historical and predictive overview of the top economies in the world, including projections all the way to 2075. Read more
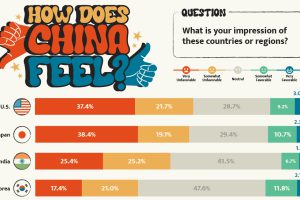
What is the Chinese public’s view of world powers? This visual breaks down Chinese sentiment towards other countries. Read more
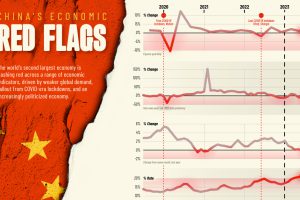
We chart six red flag indicators threatening China’s economy and it’s post-pandemic recovery, as well as global economic growth Read more
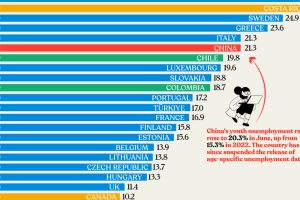
Nearly three years after COVID-19 first hit, youth unemployment in some countries, like China, has risen sharply. Read more
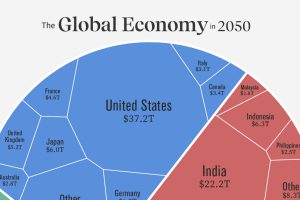
Asia is expected to represent the world’s largest share of real GDP in 2050. See how this all breaks down in one chart. Read more