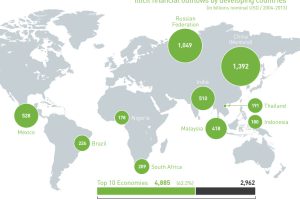
In the last decade, over $7.8 trillion of illicit financial outflows have come out of developing countries. We follow the world’s “hot” money in this chart. Read more
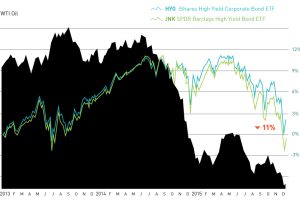
The month of December so far has seen a mini-meltdown in the junk bond market. The culprit? Fringe oil and gas producers that are struggling with low prices. Read more
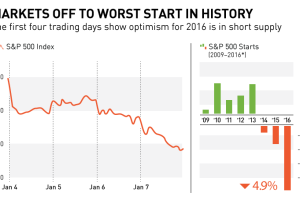
In this chart and post, we show why markets are off to their worst start in history. We also look at recent S&P 500 starts to show an interesting trend. Read more
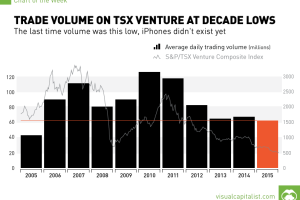
The last time volume was this low, the iPhone did not exist yet. Read more
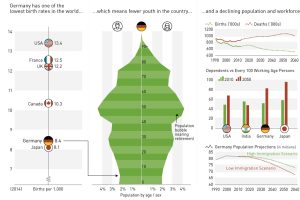
Germany’s demographic cliff, and why Europe’s largest economy could be destined to be the next Japan. Read more
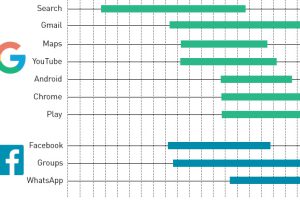
Only 12 apps have ever reached the coveted 1 billion active user mark. This timeline visualization shows how long it took each one to get there. Read more
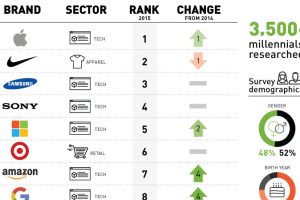
By 2020, millennials will account for 30% of all retail sales, worth $1.4 tn. Here’s the top 10 millennial brands according to a survey of 3,500 millennials Read more


