

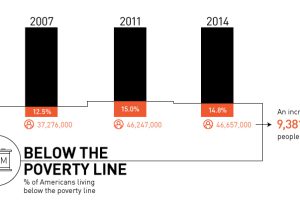
Is there really a recovery? Most recent data shows that there are 9.4 million more Americans in poverty than 2007, with growing inequality. Read more
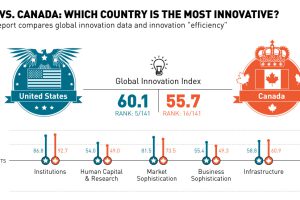
Today’s chart contrasts data from the Global Innovation Index 2015 report, to see whether it is United States or Canada that is the most innovative country. Read more
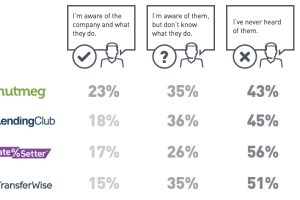
Here’s further proof that bank executives live in a bubble: the majority of execs are unaware of the very key fintech startups that seek to replace them. Read more
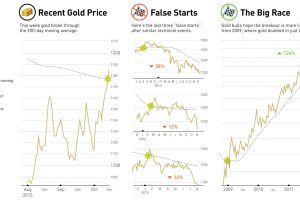
This week, gold made a technical breakthrough past its 200-day moving average. We look at past occurrences of this event, and the potential consequences. Read more
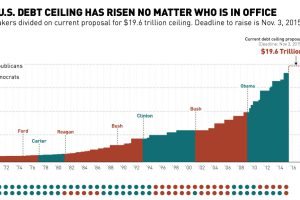
This chart shows the history of the U.S. debt ceiling from 1970 until today, including the current proposal to increase it to $19.6 trillion. Read more
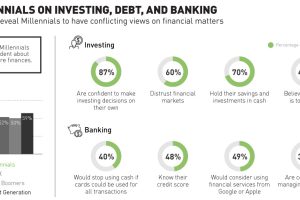
Millennials are the most confident generation about their financial future. At the same time, they seem to have conflicting views on investing, debt, and banking. Read more
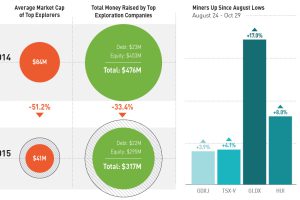
Recently, PwC published a report profiling the malaise of the Top 100 junior miners. We recap those findings, but also show why there may be signs of life. Read more
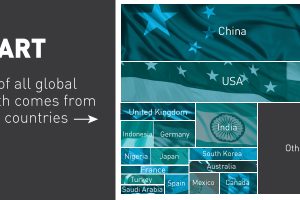
Which countries contribute the most to global economic growth? Over 80% of all growth is from 16 countries, and over half of all growth is from just two. Read more
The majority of the 391 nuclear reactors in global operation were built many years ago, and aging reactors are beginning to be a problem for the industry. Read more
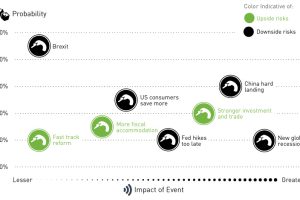
What possible events are adding upside and downside risks to the market? We chart SocGen’s latest black swan list as we edge towards 2016. Read more