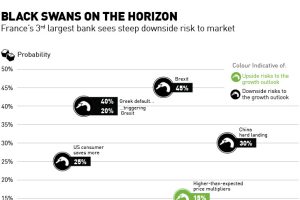
France’s third largest bank, SocGen, sees more negative black swan events on the horizon than potential upside. Read more
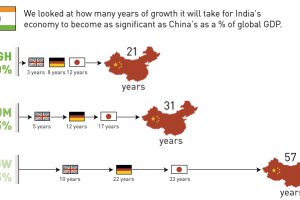
With Chinese economic growth reaching its slowest point in six years, the world is looking for a new engine. Is India the next China? Read more
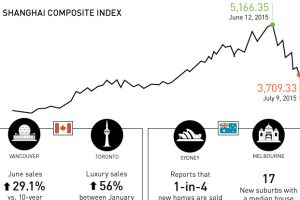
With the Chinese stock market facing extreme volatility, could investors be putting their money into foreign property ownership in Canada and Australia? Read more
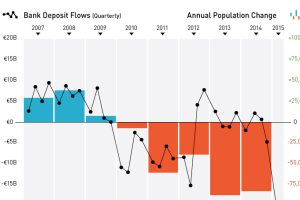
Today’s chart shows the Greek exodus, as capital and people flee the sinking Greek economic ship in unprecedented numbers. Read more
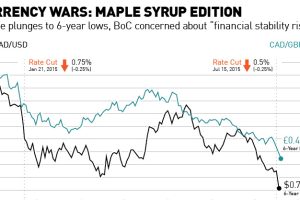
With the Canadian dollar plunging to 6-year lows after the second rate cut in six months, we look at the Maple Syrup version of a currency war. Read more
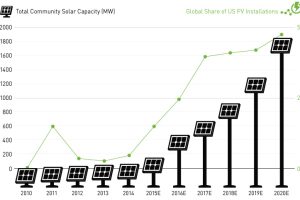
New installations of community solar farms are taking off, with cumulative capacity in the United States to increase sevenfold over the next two years. Read more

In the aftermath of the first GOP debate, we combined three post-debate polls. The results: 44% say Trump wins debate, with Rubio and Carson surprising. Read more
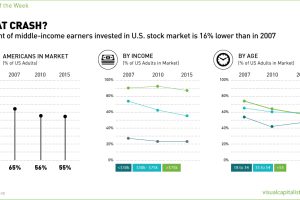
Polls show that fewer Americans are in the stock market than in the last two decades. The biggest casualties have been lower and middle income earners. Read more

In the midst of its worst refugee crisis since World War II, we look at who accepts the most and least migrants in Europe. Read more


