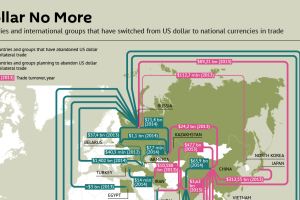
Recent trade deals and the creation of the Asian Infrastructure Investment Bank show the dollar is slowly losing its status as the primary reserve currency. Read more
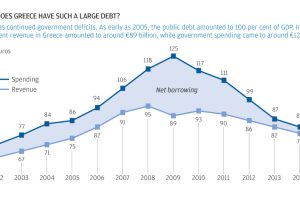
The story of Greece’s debt crisis through charts. The origin of the Greek crisis shown in bond yields, population, unemployment, timeline, and more. Read more
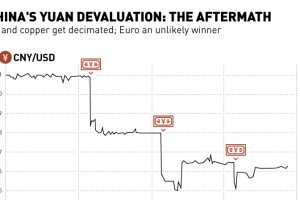
The People’s Bank of China shook markets this week with three separate yuan devaluations. Here’s the aftermath of these moves in currencies and commodities. Read more

Plunging oil prices have profound effects on major importers and exporters of oil. In this case, we look at how currencies of net exporters are impacted. Read more

Polls show that fewer Americans are in the stock market than in the last two decades. The biggest casualties have been lower and middle income earners. Read more

This infographic covers 33 little-known U.S. currency facts about the bills and coins in circulation today. Read more
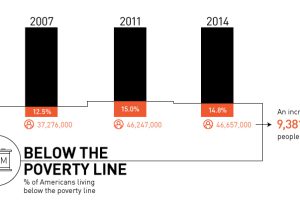
Is there really a recovery? Most recent data shows that there are 9.4 million more Americans in poverty than 2007, with growing inequality. Read more

In terms of actual capacity to pay debt, the United States has the 2nd highest amount in the world. We compare debt to revenue in this data visualization. Read more
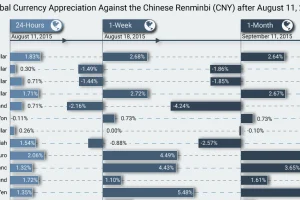
On August 11, China’s central banks shocked markets by devaluating the yuan in the biggest move in 20 years. Over one month later, here is the impact. Read more
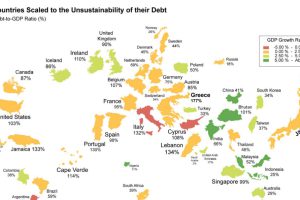
What if the world was remapped based on national debt levels? What would the largest country be? See the world map of debt. Read more

