


Tesla is also the most valuable auto maker in the U.S., surpassing Ford and GM – but by other measures, the company’s numbers are far less convincing. Read more
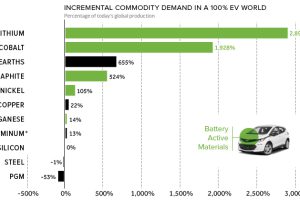
Based on the teardown of a Chevy Bolt, this chart reveals how annual commodity demand would be affected in a hypothetical 100% EV world. Read more
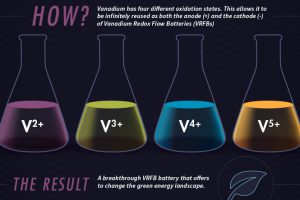
Using vanadium’s 4 different oxidation states, vanadium redox flow batteries (VRFBs) could be a crucial step forward for energy storage in the green revolution. Read more
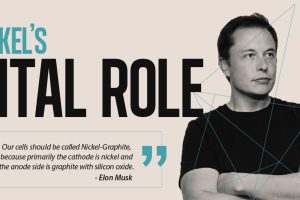
Nickel is the most important metal by mass in lithium-ion batteries, and its role is only increasing going forward. Read more

This infographic tells Tesla’s history like no other. From being on the brink of bankruptcy to Musk’s dramatic takeover, see Tesla’s early story in graphics. Read more
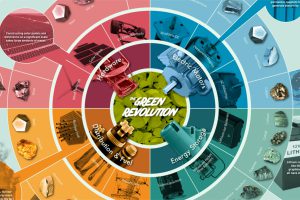
To get off fossil fuels, we’ll need other finite resources such as rare metals and minerals. Here are the resources that will power the green revolution. Read more

This infographic is Part 2 of our Rise of Tesla Series, and it document’s the company’s rapid growth from its 2010 IPO until today. Read more

The third infographic in our Rise of Tesla Series showcases Musk’s ambitious vision for the future of Tesla, along with the products that will make it possible. Read more
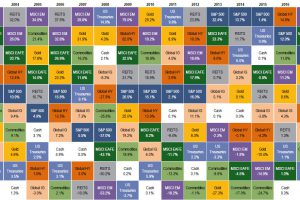
Commodities have kicked off the year as the top performing asset class. Could the commodity supercycle be back from the dead? Read more
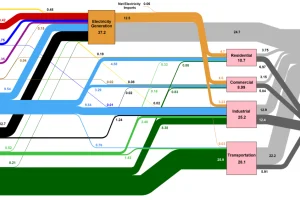
How is the country’s energy generated, and how is it consumed? This nifty Sankey diagram shows U.S. energy consumption in a simple and understandable way. Read more