
Even though the world’s biggest companies invest deeply in their brand identities, that doesn’t mean they stay static. Here’s how logos evolve over time. Read more
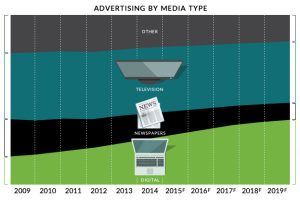
Digital media will be the largest advertising channel globally by 2019 – even bigger than television. This chart covers the death of traditional media. Read more
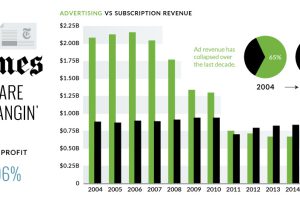
The New York Times just announced a 95.7% decrease in quarterly profits – we look at the numbers and context around the NYT’s digital transition. Read more

Is there correlation between mobile searches and Black Friday foot traffic? This infographic uses Google data to make 4 predictions about Black Friday shoppers. Read more
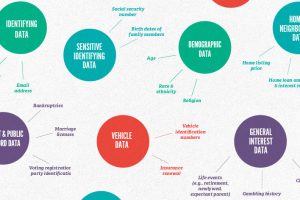
Services like Google and Facebook may seem free, but they actually come at a cost: your personal data. Find out what it’s worth to marketers and brokers. Read more
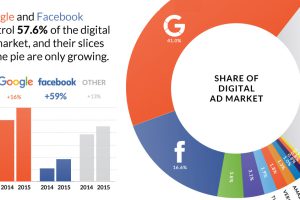
Nearly $0.60 of every $1.00 spent on digital advertising goes to Google and Facebook. Read more
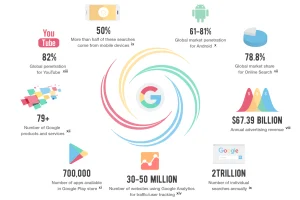
The search giant is everywhere. Here’s why and how Google tracks you, what it means for your privacy, and how you can see your information. Read more
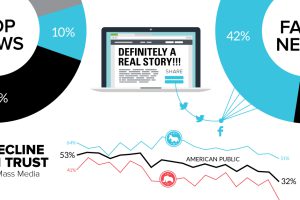
Social media isn’t solely to blame for so-called fake news. The rapid decline in the trust of mass media and other institutions are factors as well. Read more
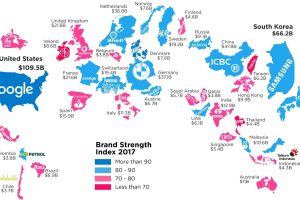
What is a top brand worth? This infographic highlights the most valuable brand in each country, according to the 2017 Brand Finance report. Read more
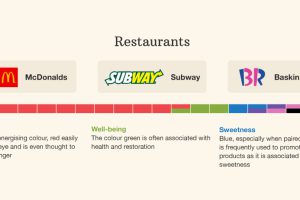
This infographic breaks down the colors used in branding across industries – and it shows how different colors can mean different things based on context. Read more

