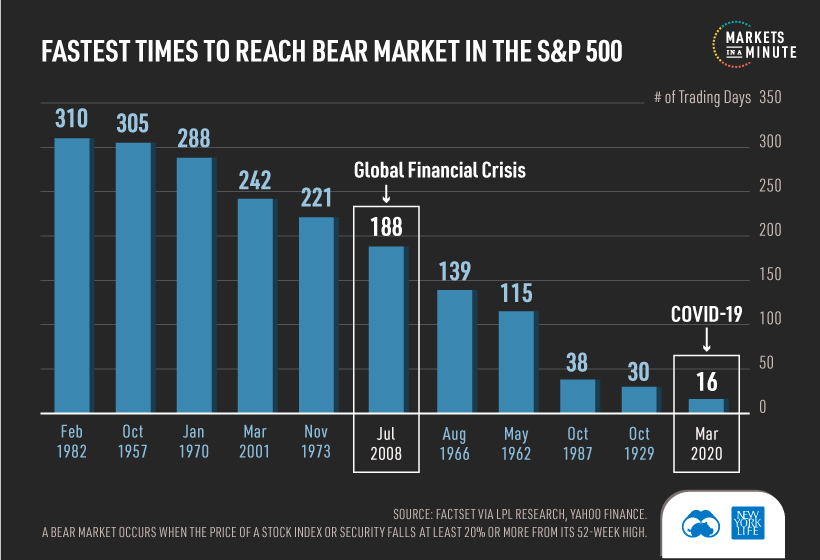
This Markets in a Minute chart is available as a poster.
Black Swans: Short-term Crisis, Long-term Opportunity
Few investors could have predicted that a viral outbreak would end the longest-running bull market in U.S. history. Now, the COVID-19 pandemic has pushed stocks far into bear market territory. From its peak on February 19th, the S&P 500 has fallen almost 30%.
While this volatility can cause investors to panic, it’s helpful to keep a long-term perspective. Black swan events, which are defined as rare and unexpected events with severe consequences, have come and gone throughout history.
In today’s Markets in a Minute chart from New York Life Investments, we explore the sell-off size and recovery length for some of these events.
Wars, Viruses, and Excessive Valuations
With sell-offs ranging from -5% to -50%, black swan events have all impacted the S&P 500 differently. Here’s a look at select events over the last half-century:
| Event | Start of Sell-off/Previous Peak | Size of Sell-off | Duration of Sell-off (Trading Days) | Duration of Recovery (Trading Days) |
|---|---|---|---|---|
| Israel Arab War/Oil Embargo | October 29, 1973 | -17.1% | 27 | 1475 |
| Iranian Hostage Crisis | October 5, 1979 | -10.2% | 24 | 51 |
| Black Monday | October 13, 1987 | -28.5% | 5 | 398 |
| First Gulf War | January 1, 1991 | -5.7% | 6 | 8 |
| 9/11 Attacks | September 10, 2001 | -11.6% | 6 | 15 |
| SARS | January 14, 2003 | -14.1% | 39 | 40 |
| Global Financial Crisis | October 9, 2007 | -56.8% | 356 | 1022 |
| Intervention in Libya | February 18, 2011 | -6.4% | 18 | 29 |
| Brexit Vote | June 8, 2016 | -5.6% | 14 | 9 |
| COVID-19* | February 19, 2020 | -29.5% | 19 | N/A (ongoing) |
* Figure as of market close on March 18, 2020. The sell-off measures from the market high to the market low.
While the declines can be severe, most have been short-lived. Markets typically returned to previous peak levels in no more than a couple of months. The Oil Embargo, Black Monday, and the Global Financial Crisis are notable outliers, with the recovery spanning a year or more.
After Black Monday, the Federal Reserve reaffirmed its readiness to provide liquidity, and the market recovered in about 400 trading days. Both the 1973 Oil Embargo and 2007 Global Financial Crisis led to U.S. recessions, lengthening the recovery over multiple years.
COVID-19: How Long Will it Last?
It’s difficult to predict how long COVID-19 will impact markets, as its societal and financial disruption is unprecedented. In fact, the S&P 500 reached a bear market in just 16 days, the fastest time period on record.

Some Wall Street strategists believe that the market will only begin to recover when COVID-19’s daily infection rate peaks. In the meantime, governments have begun announcing rate cuts and fiscal stimulus in order to help stabilize the economy.
Considering the high levels of uncertainty, what should investors do?
Buy on Fear, Sell on Greed?
Legendary investor Warren Buffet is a big proponent of this strategy. When others are greedy—typically when prices are boiling over—assets may be overpriced. On the flipside, there may be good buying opportunities when others are fearful.
Most importantly, investors need to remain disciplined with their investment process throughout the volatility. History has shown that markets will eventually recover, and may reward patient investors.
Note: This post originally came from our Advisor Channel, a partnership with New York Life Investments that aims to create a go-to resource for financial advisors and their clients to navigate market trends.


