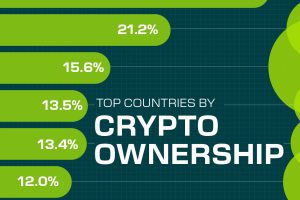
While the U.S. is a major market for cryptocurrencies, two countries surpass it in terms of their rates of crypto ownership. Read more

A survey during peak tax filing season reveals two big complaints that Americans have with the federal tax system. Read more

Tax burden measures the percent of an individual’s income that is paid towards taxes. See where it’s the highest by state in this graphic. Read more
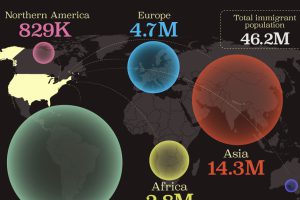
This map shows which regions U.S. immigrants came from, highlighting Asia and Latin America as the biggest sources. Read more
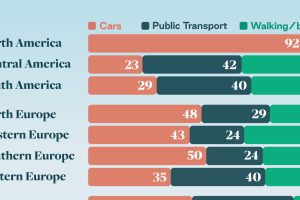
Examining how people get around using cars, public transit, and walking or biking, and the regional differences in usage. Read more
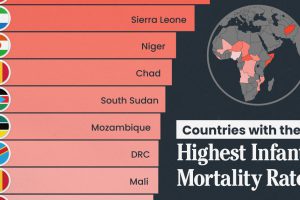
We visualize the 15 countries with the highest infant mortality rates, including countries from Africa and the Middle East. Read more

Indonesia, the region’s largest economy, makes the top five in this map exploring Southeast Asia’s GDP per capita levels. Read more


