

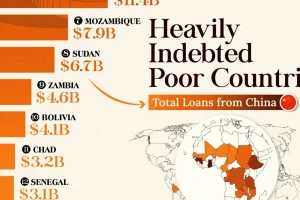
This infographic lists countries in Africa and other developing regions that received billions in loans from China. Read more
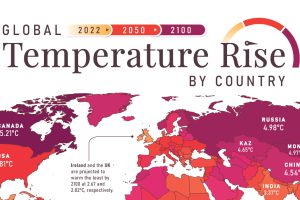
In this set of three maps, we show the global temperature rise on a national level for 2022, 2050, and 2100 based on an analysis by Berkeley Earth. Read more
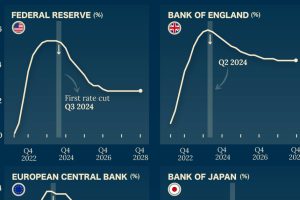
Which economies are expected to see interest rates rise, or fall? We highlight IMF forecasts for international interest rates through 2028. Read more

Donald Trump, Mitt Romney, J.B. Pritzker. This infographic is a snapshot of the richest politicians in the U.S. Read more

In this series of maps, we explain the dispute that has spanned nearly two centuries over the vast Essequibo region. Read more

Which companies spend the most on traditional TV advertising? From pharmaceutical giants to big tech firms, we show the top spenders in 2023. Read more
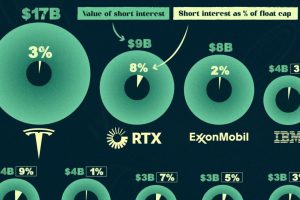
In this infographic, we list the 15 most shorted stocks in the U.S. in the Fall of 2023, ranked by the value of their short interest. Read more
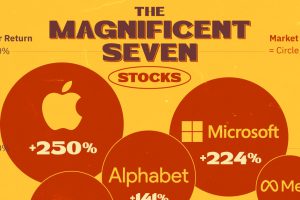
FAANG is dead… meet the ‘Magnificent Seven’ stocks that now make up over 25% of the S&P 500. Read more
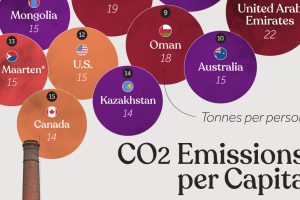
Which countries rank the highest in per capita carbon emissions, and how do they impact the world’s total carbon emissions? Read more
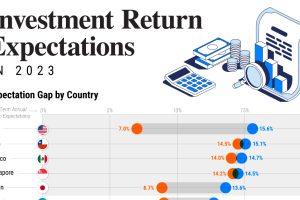
This graphic shows the gap in portfolio return expectations between investors and advisors around the world, revealing a range of market outlooks. Read more