


Here’s a preview of our much-anticipated 2024 Global Forecast Series, the U.S. military’s annual report on China and and much more. Read more
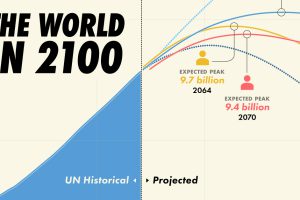
Population projections from the UN suggest that there will be over 10 billion people by 2060, though other organizations disagree. Read more
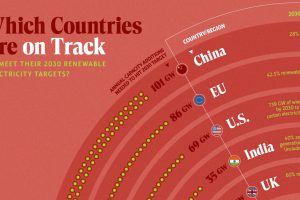
In this graphic, we visualize whether major electricity-consuming countries are on track to meet their 2030 renewable energy targets. Read more
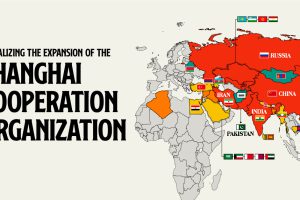
Established by China, Russia, and former Soviet states, the SCO serves as a counterbalance to Western influence in Eurasia. Read more
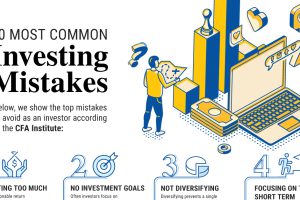
Here are the most common investing mistakes to avoid, from emotionally-driven investing to paying too much in fees. Read more

Considered a side show in the stock market for much of the last decade, U.S. retail investors are now breaking records. Read more
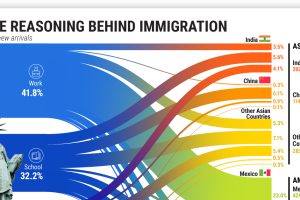
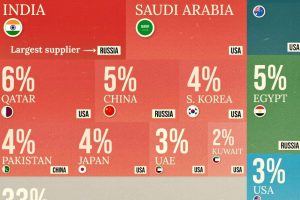
More than 45 million American residents were immigrants in 2021, having moved for various reasons. Read more
Which countries imported weapons to boost their defenses in 2022? We rank the biggest by their the share of global arms imports. Read more

Services-producing industries account for the majority of U.S. GDP in 2023, followed by other private industries and the government. Read more
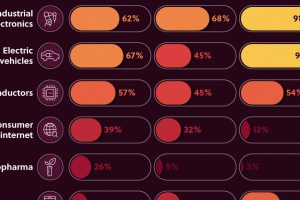
We look at the share of Asian companies in the top 3,000 global firms—measured by market capitalization in 2020—broken down by industry. Read more