

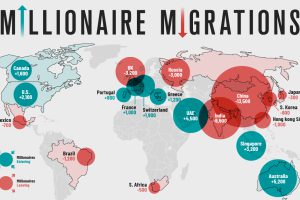
Where do the world’s wealthiest people want to live? This map tracks the migration of the world’s High Net Worth Individuals (HNWIs). Read more
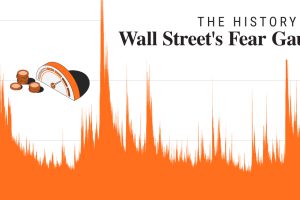
In 2023, market volatility has fallen dramatically. In this graphic, we show how it compares to historical trends. Read more
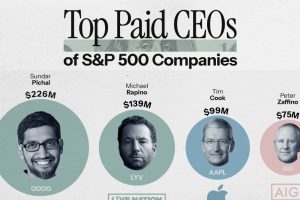
This graphic reveals the top 20 highest paid CEOs in the S&P 500 from Sundar Pichai to Jamie Dimon. Read more

Considering factors like the cost of investment and number of locations, this graphic breaks down the best franchises in the U.S. Read more

This month’s VC+ special dispatches feature a deep dive into BRICS’ history and markets this month. Read more

Check out the Fra Mauro Mappa Mundi (c. 1450s), a historical map that formed a bridge between medieval and renaissance worldviews. Read more
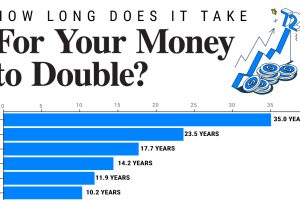
Since 1949, the S&P 500 has doubled in value 10 times. We show how long it takes to double your money across a range of annualized returns. Read more
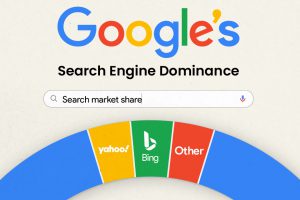
Google’s dominant search engine market share has prompted the U.S. Justice Department to file a lawsuit over anticompetitive practices. Read more
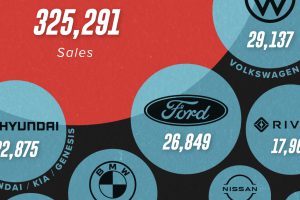
U.S. EV sales continue to be dominated by Tesla, which outsold all of its competitors combined in H1 2023. Read more
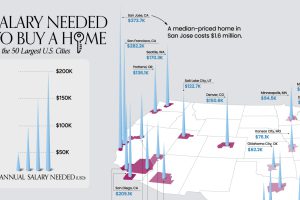
What does it take to own a home in the U.S. in 2023? Here’s a look at the salary needed for home ownership in the top 50 metro areas. Read more