

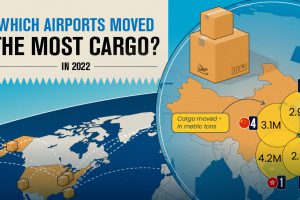
Cargo that moves through airports represents the value of around 35% of world trade. These hubs move the most cargo globally. Read more
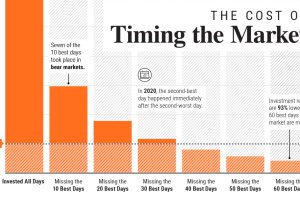
In this graphic, we show why timing the market is extremely difficult, and how it can meaningfully dent portfolio returns. Read more

The periodic table of elements is widely recognized, but there are hundreds of beautiful and different periodic table reinterpretations. Read more
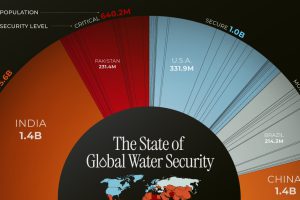
This chart highlights the different countries, and the number of people, facing water security issues around the world. Read more
Join VC+ Lifetime this month and get the best visual insights for the best value. See what else VC+ members receive in August! Read more

How much does each country contribute to the $105 trillion world economy in 2023, and what nations are seeing their nominal GDPs shrink? Read more

The majority of billion-dollar startups in the U.S. have at least one immigrant founder. Here is where those founders are from. Read more

Internet adoption is widespread in the U.S. In fact, only 7% of Americans do not use the internet. Who are these non-adopters? Read more
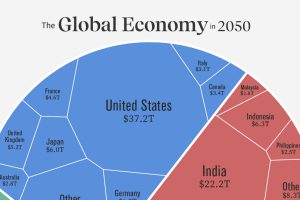
Asia is expected to represent the world’s largest share of real GDP in 2050. See how this all breaks down in one chart. Read more
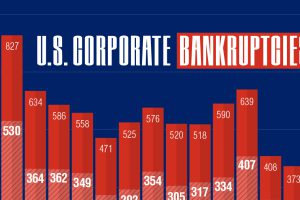
In 2023, over 400 companies have folded. This graphic shows how corporate bankruptcies are growing at the second-fastest rate since 2010. Read more