

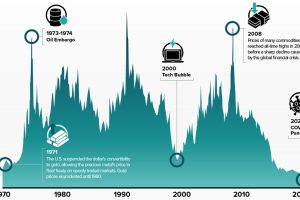
The commodities-to-equities ratio recently hit a 50-year low. In the past, when this ratio reached such levels, commodity supercycles began. Read more
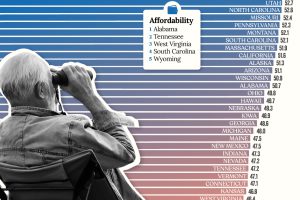
Getting ready for retirement? See which states score the highest in terms of affordability, quality of life, and health care. Read more
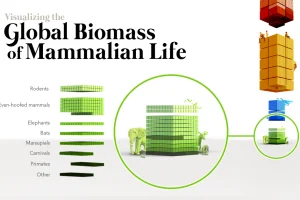
When the world’s biomass—the stuff we’re made of—is tallied up, humans and cattle outweigh wild mammals by a massive margin. Read more

We visualize the performance of ChatGPT in various professional and academic exams, highlighting the improvements of GPT-4 over GPT-3.5. Read more
How many countries globally are true democracies? This map showcases the state of democracy in every country worldwide. Read more
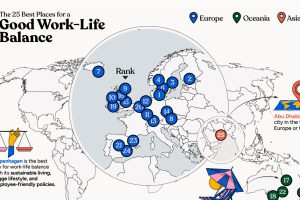
In this infographic, we explore which cities around the world excel in prioritizing work–life balance. Read more
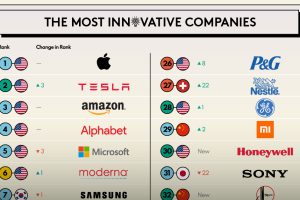
Which companies prioritize innovation the most? This infographic highlights BCG’s 2023 Most Innovative Companies ranking. Read more
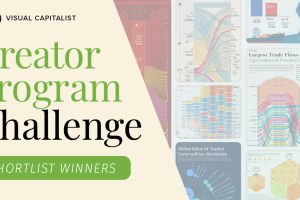
How do you visualize trade? These 9 graphics on the topic are the shortlist winners of our inaugural Creator Program Challenge. Read more
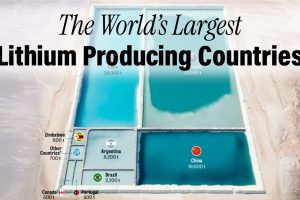
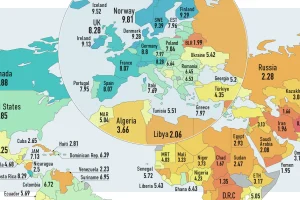
Which countries produce the most lithium, and which have the most in reserves in the ground? We look at 2022 data from the USGS. Read more
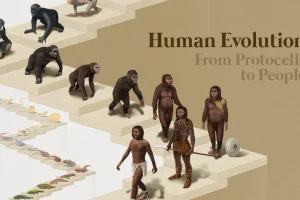
From single cells to bipedalism, humans have come a long way. Explore the fascinating journey of human evolution in this infographic. Read more