

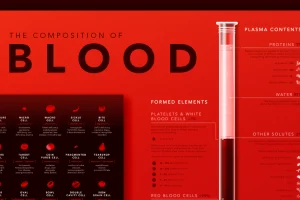
Despite its simple appearance, blood is made up of many microscopic elements. This infographic visualizes the composition of blood. Read more
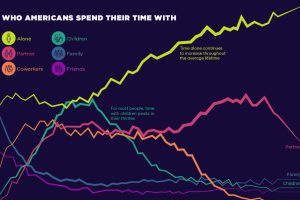
Social connections evolve throughout our lifetimes. Here we chart how much time Americans spend with others, and who that time is spent with. Read more
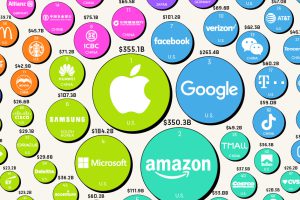
A strong brand is extremely lucrative when leveraged properly. Here’s a look at the most valuable brands in 2022, according to Brand Finance. Read more
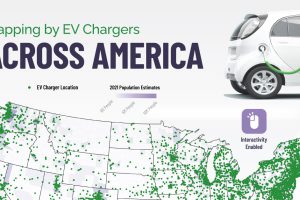
Looking for an EV charging station in the states? This interactive map contains every EV charging station in America. Read more
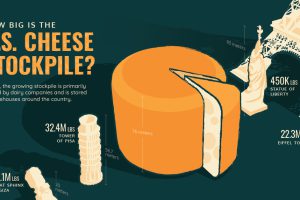
The U.S. has 1.5 billion pounds of cheese in cold storage across the country—around $3.4 billion worth of cheese. Read more
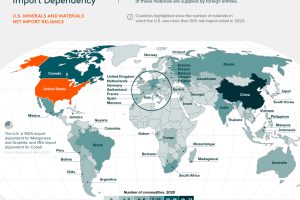
A handful of materials are increasingly crucial for the next generation of emerging technologies. But as the data shows, the U.S. is heavily reliant on foreign nations to supply these… Read more

Many countries around the world are facing double or triple-digit inflation. See which countries have the highest inflation rates on this map. Read more
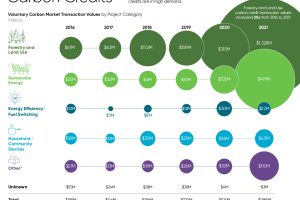
Carbon credits from nature-based solutions are in high demand as organizations look to shrink their carbon footprints. Read more
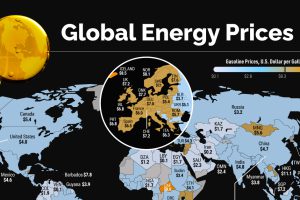
Energy prices have been extremely volatile in 2022. Which countries are seeing the highest prices in the world? Read more
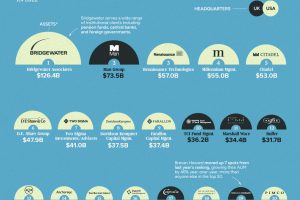
This annual ranking shows the world’s largest hedge funds, which collectively hold an estimated $45 trillion in assets under management. Read more