


The world’s most surveilled cities contain hundreds of thousands of cameras. View this infographic to see the data in perspective. Read more
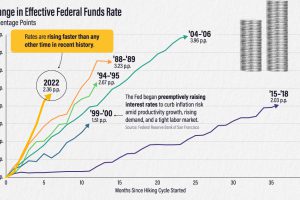
The effective federal funds rate has risen more than two percentage points in six months. How does this compare to other interest rate hikes? Read more
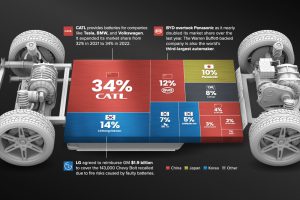
Despite efforts from the U.S. and Europe to increase the domestic production of batteries, the market is still dominated by Asian suppliers. Read more
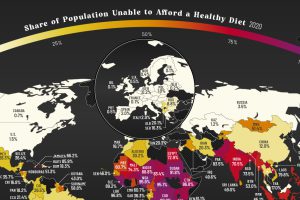
More than three billion people across the globe are unable to afford a healthy diet. See which countries are most affected. Read more
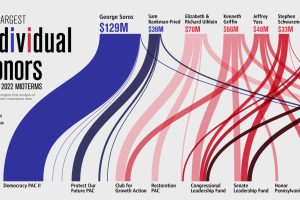
A record-smashing $9 billion has been raised for the 2022 midterm elections. See who the top 10 donors are in this graphic. Read more
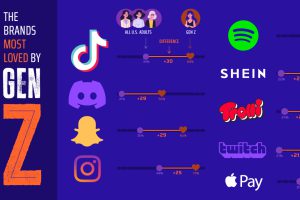
Which brands win the most with Gen Z compared to older generations? From TikTok to Capri Sun, this ranking looks at Gen Z’s favorite brands. Read more

Despite its simple appearance, blood is made up of many microscopic elements. This infographic visualizes the composition of blood. Read more
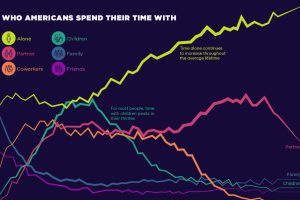
Social connections evolve throughout our lifetimes. Here we chart how much time Americans spend with others, and who that time is spent with. Read more
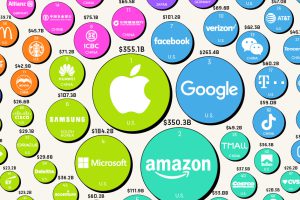
A strong brand is extremely lucrative when leveraged properly. Here’s a look at the most valuable brands in 2022, according to Brand Finance. Read more
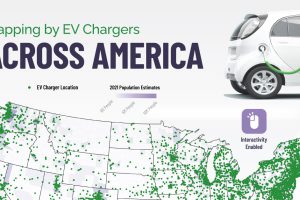
Looking for an EV charging station in the states? This interactive map contains every EV charging station in America. Read more