

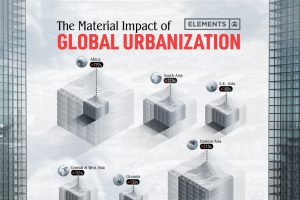
The world’s material consumption is expected to grow from 41 billion tonnes in 2010 to about 89 billion tonnes by 2050. This graphic shows the impact of urbanization. Read more
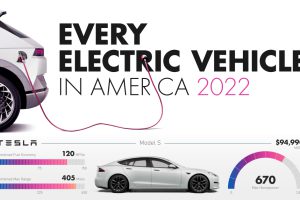
When it comes to purchasing electric cars, Americans have a few to choose from. Here’s a look at every electric vehicle sold in the U.S. Read more
Just how powerful are nuclear bombs? Here’s a look at the top 10 largest nuclear explosions. Read more
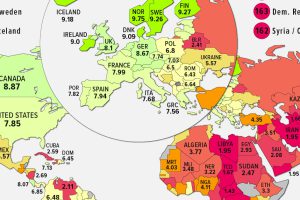
We map the state of global democracy, as the Democracy Index hits its lowest point since the inception of the index in 2006. Read more

Six of the top 10 most downloaded apps in Q1 2022 were social media apps, and four of them are owned by Meta. Read more
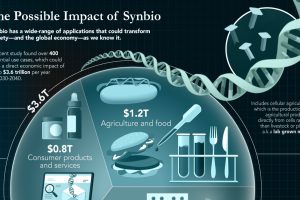
The field of synthetic biology could solve problems in a wide range of industries, from medicine to agriculture—here’s how. Read more
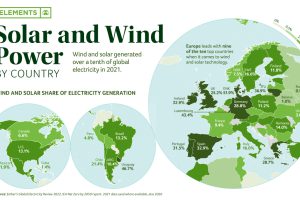
Wind and solar make up 10% of the world’s electricity. Combined, they are the fourth-largest source of electricity after coal, gas, and hydro. Read more
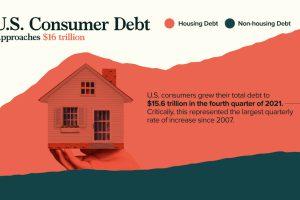
Robust growth in mortgages has pushed U.S. consumer debt to nearly $16 trillion. Click to gain further insight into the situation. Read more

Here’s a sneak preview of features that VC+ members will have delivered straight to their inboxes in May 2022. Read more
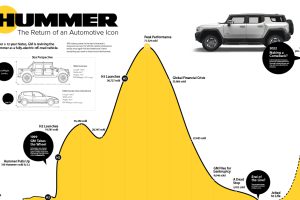
GM has received over 65,000 preorders for its upcoming Hummer EV. See how this compares to the brand’s previous sales in one infographic. Read more