

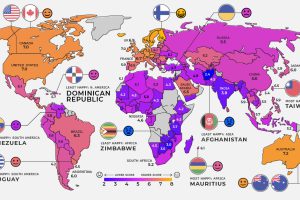
Global happiness levels are determined by several different factors. Here’s a look at the happiest and unhappiest countries in every region. Read more
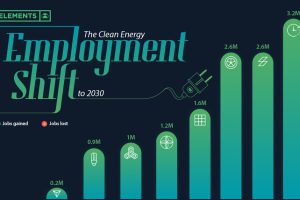
Will the clean energy transition create jobs, or will jobs be lost? Here is projected employment growth in clean energy and related sectors to 2030. Read more

Russia faces a multitude of U.S. sanctions for its participation in global conflicts. This infographic lists who and what has been impacted. Read more
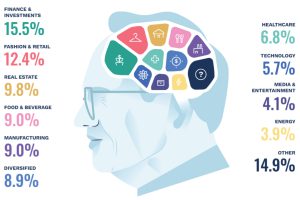
From Warren Buffett to Elon Musk, this graphic shows the world’s billionaires based on their top sectors, residence, and net worth. Read more
Nuclear weapons have devastating effects, but the science of how they work is atomically small. So, how do nuclear weapons work? Read more
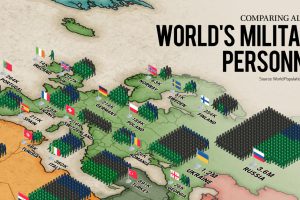
Which countries have the biggest militaries in the world? This map reveals all the world’s military personnel. Read more
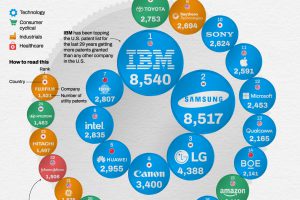
Companies around the world invest billions in R&D to provide cutting-edge innovation to their products and services. Read more
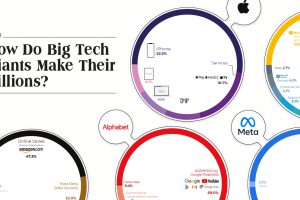
The Big Five tech companies made $1.4 trillion in revenue combined—more than Mexico’s entire GDP. Here’s how they earned it all. Read more
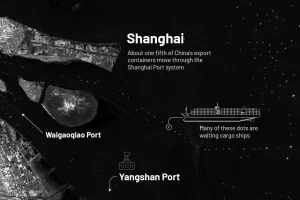
China’s lockdown of Shanghai is causing massive back-ups at the world’s largest container port. Hundreds of ships are now waiting at sea. Read more
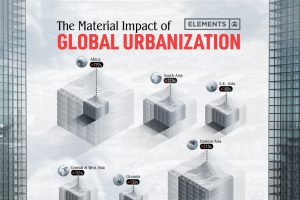
The world’s material consumption is expected to grow from 41 billion tonnes in 2010 to about 89 billion tonnes by 2050. This graphic shows the impact of urbanization. Read more