

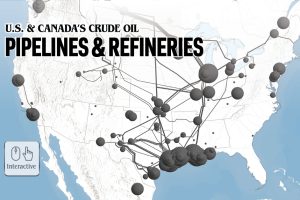
Explore North America’s crude oil pipelines and refineries across the U.S. and Canada in our interactive map. Read more
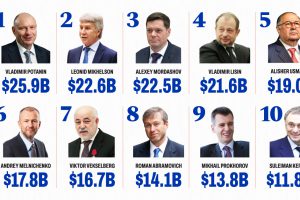
Russian billionaires have lost more than $38 billion in 2022 because of Western sanctions on Russia in reprisal for the invasion of Ukraine. Read more
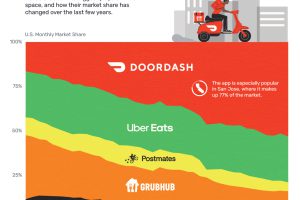
This chart shows how DoorDash and Uber Eats have come to control over 75% of the U.S. food delivery market Read more
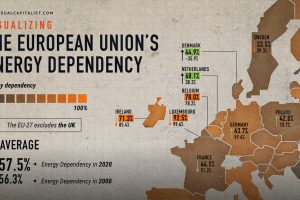
The EU’s energy dependency has become a major issue amid Russia’s invasion of Ukraine. See what the data says in this infographic. Read more
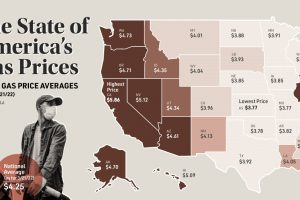
This map looks at gas prices across various states, and historical context for today’s sky-high prices at the pump. Read more
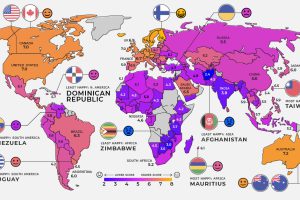
Global happiness levels are determined by several different factors. Here’s a look at the happiest and unhappiest countries in every region. Read more
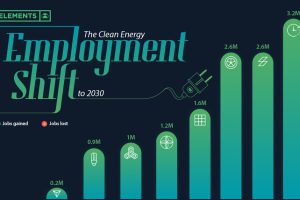
Will the clean energy transition create jobs, or will jobs be lost? Here is projected employment growth in clean energy and related sectors to 2030. Read more
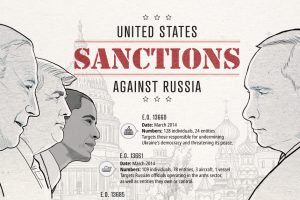
Russia faces a multitude of U.S. sanctions for its participation in global conflicts. This infographic lists who and what has been impacted. Read more
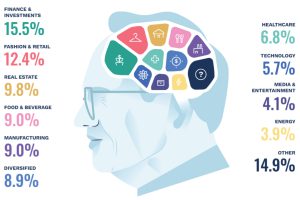
From Warren Buffett to Elon Musk, this graphic shows the world’s billionaires based on their top sectors, residence, and net worth. Read more
Nuclear weapons have devastating effects, but the science of how they work is atomically small. So, how do nuclear weapons work? Read more