

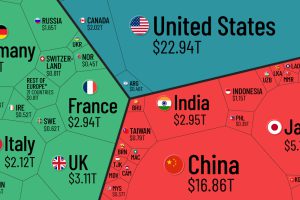
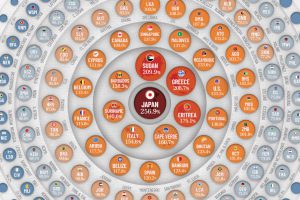
Which countries and regions contribute the most to the world economy? In this infographic, we break down all $94 trillion of global GDP by country. Read more
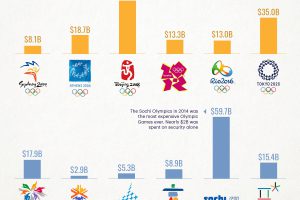
Hosting the Olympics is an honor that comes with great financial responsibility. Here’s how much host cities have spent in recent times. Read more
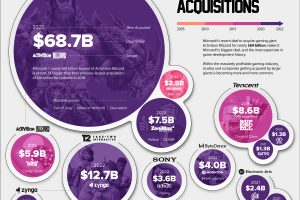
Microsoft’s acquisition of Activision Blizzard was the biggest in history. Here we visualize the top 15 biggest gaming company acquisitions. Read more
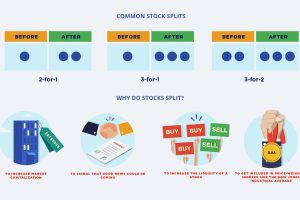
If companies want their stock price to rise, why would they want to split it, effectively lowering the price? This infographic explains why. Read more
Global debt reached $226T by the end of 2020 – the biggest one-year jump since WWII. This graphic compares the debt-to-GDP ratio of various countries. Read more
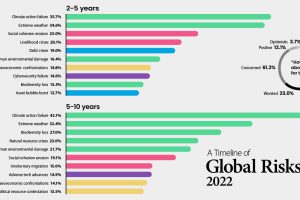
Which risks are top of mind in 2022? We visualize the World Economic Forum’s global risk assessment for top risks by impact and livelihood. Read more
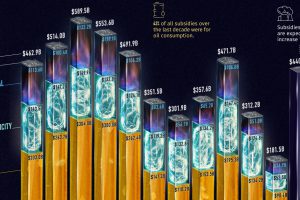
Governments pour nearly $500 billion into fossil fuel subsidies annually. This chart breaks down fossil fuel subsidies between 2010 and 2021. Read more
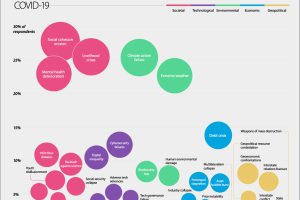
According to the World Economic Forum, the erosion of social cohesion is one of the risks that has worsened the most since COVID-19. Read more

How much does a space flight cost? Here’s a look at the cost per kilogram for space launches across the globe since 1960. Read more

Feeling disconnected? This infographic teaches you how to build strong leadership communities in your organization in a hybrid working world. Read more