

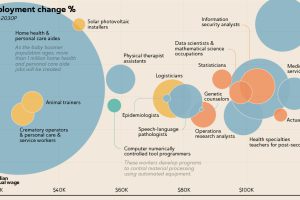
The U.S. Bureau of Labor Statistics predicts an overall job growth rate of 7.7%. Here, we show the fastest growing jobs and how much they pay. Read more
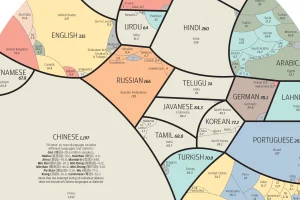
See the world’s major languages broken down by country in this stunning visualization. Read more
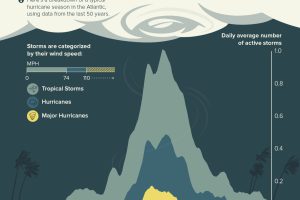
While the Atlantic hurricane season runs from June to late November, about 85% of activity happens between August, September, and October. Read more
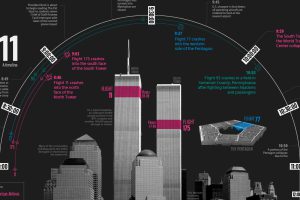
This timeline visualization is a high-level record of what happened on the fateful morning of September 11, 2001 Read more
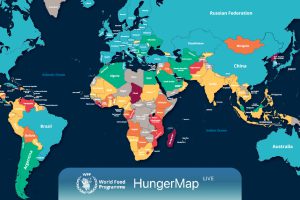
Every day, hunger affects more than 700 million people. This live map from the UN highlights where hunger is hitting hardest around the world. Read more
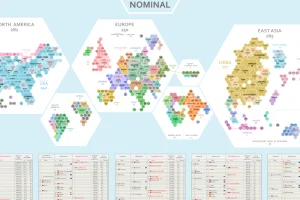
Where does the world’s economic activity take place? This cartogram shows the $94 trillion global economy divided into 1,000 hexagons. Read more
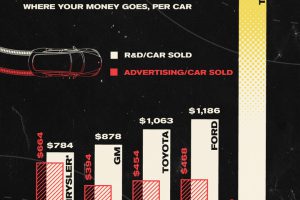
How much does Tesla spend on a per car basis on innovation and marketing, compared to more traditional automakers? Read more
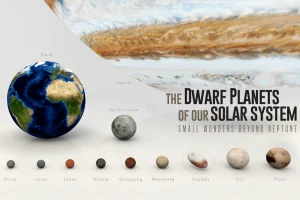
Since dwarf planets started being classified in 2005, nine have been recognized. Here we visually introduce the dwarf planets in our solar system. Read more
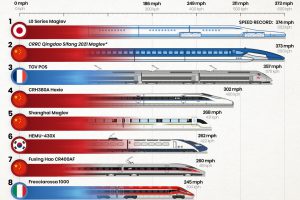
Which country has the fastest trains in the world, and how fast can they go? Read more
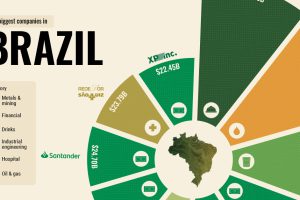
What drives some of the world’s emerging economies? From natural resources to giant banks, here are the top 10 biggest companies in Brazil. Read more