

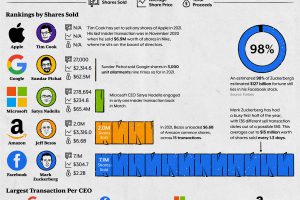
Big Tech is worth trillions, but what are insiders doing with their stock? We breakdown Big Tech CEO insider trading during the first half of 2021. Read more
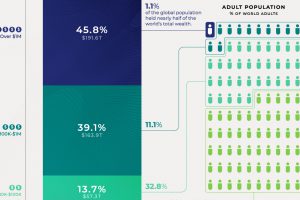
Global wealth at the end of 2020 was about $418 trillion. Here’s a breakdown of the global wealth distribution among the adult population. Read more
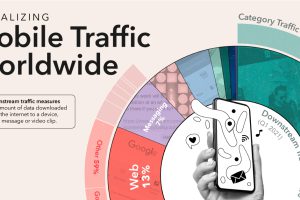
Of the millions of apps available around the world, just a small handful of the most used apps dominate global internet traffic. Read more

Here’s a look at the number of wildfires in America that have occurred each year since 1990, and the acres of forest land scorched during that period. Read more
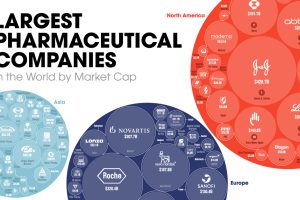
The world’s biggest pharmaceutical companies are worth $4.1 trillion. Here we map the top 100 companies based on their market cap value. Read more
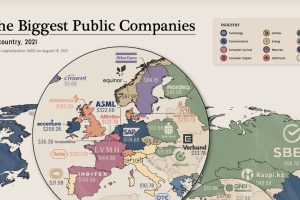
Tech, finance or energy giant? We mapped the biggest companies by market cap and industry. Read more
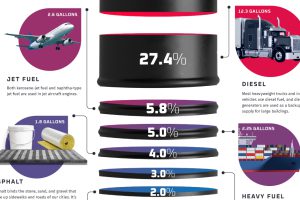
Oil is a building block that makes modern life possible. Here are the proportion of finished products that are created from a barrel of oil. Read more
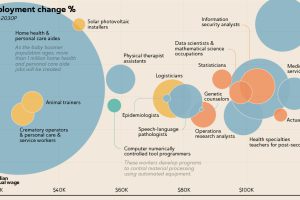
The U.S. Bureau of Labor Statistics predicts an overall job growth rate of 7.7%. Here, we show the fastest growing jobs and how much they pay. Read more
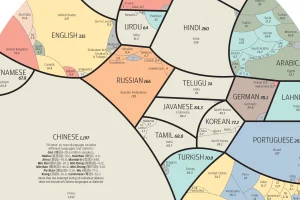
See the world’s major languages broken down by country in this stunning visualization. Read more
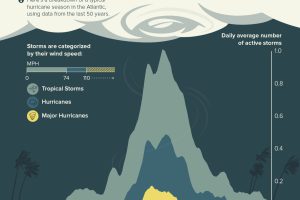
While the Atlantic hurricane season runs from June to late November, about 85% of activity happens between August, September, and October. Read more