

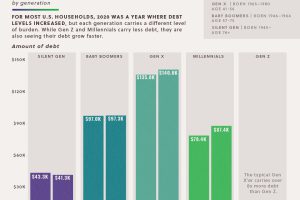
The majority of U.S. households saw debts rise in 2020. This data looks at the growth in household debt and the existing debt pile, by generation Read more
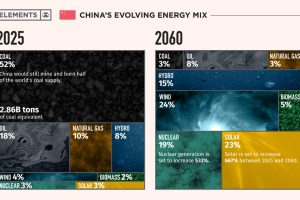
This infographic takes a look at what China’s energy transition plans are to make its energy mix carbon neutral by 2060. Read more
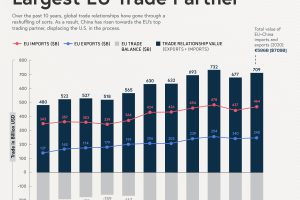
China has spearheaded its economy towards a global superpower, and as a result, has overtaken the U.S. as the EUs top trade partner Read more
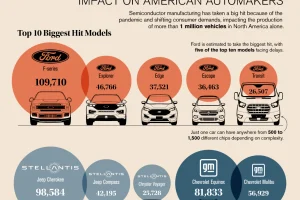
As the global chip shortage causes delays in automotive production, what models and manufacturers are being hit the hardest? Read more
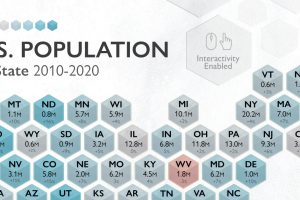
The U.S. saw 7.4% population growth in the past decade, the lowest it’s been since the 1930s. How does population by state look today? Read more
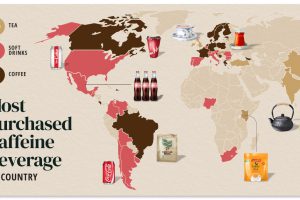
Do you drink coffee, tea, or cola? Each country has their own drink preference. Read more
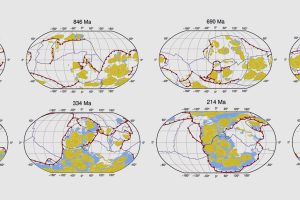
This animated map shows the last billion years of Earth’s tectonic plate movement in just 40 seconds. Read more
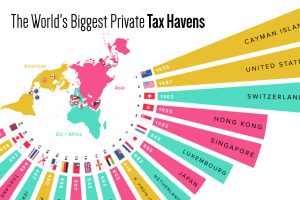
What countries or territories do the ultra-wealthy use as tax havens? Read more
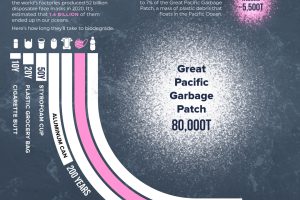
1.6 billion face masks entered our oceans in 2020, representing 5,500 tons of plastic pollution. Read more
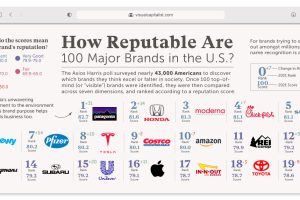
What comes to mind when you think of a good or bad brand? This poll ranks the brand reputation of 100 major companies in America. Read more