

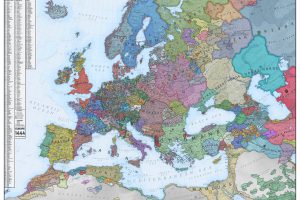
What did Europe look like in the Middle Ages? This map is a snapshot of medieval Europe back in 1444, during the rise of the Ottoman Empire. Read more
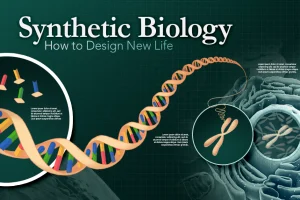
Synthetic biology (SynBio) is a field of science that involves engineering life for human benefit. Here’s an in-depth look at how it works. Read more

This infographic examines trends in each generation’s media consumption to see how Americans adapted during the pandemic. Read more
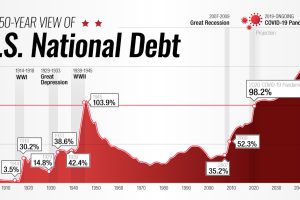
This interactive visual shows how the U.S. national debt has fluctuated since 1900, as well as projections all the way to 2050. Read more
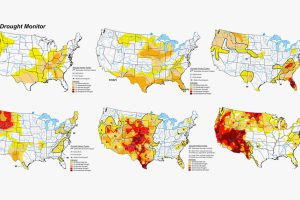
The Western U.S. is no stranger to droughts. But this year’s is one of the worst yet. Here’s a historical look at U.S. droughts since 1999. Read more
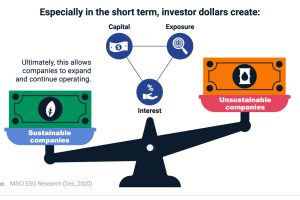
Do sustainable investments make a difference? From carbon emissions to board diversity, we break down their impact across three industries. Read more
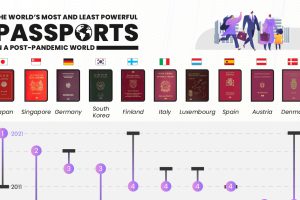
Ranking the the world’s most powerful passports based on access to visa-free destinations. Where does your country fall on the list? Read more
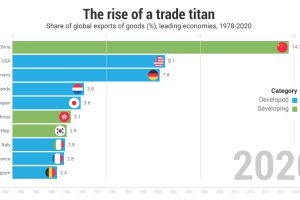
China’s economy today is completely different than 40 years ago; in 2021 the country makes up the highest share of exports globally. Read more
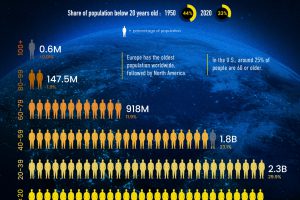
33% of the world’s population is under 20, making young people the largest demographic worldwide. But this might not be the case forever. Read more
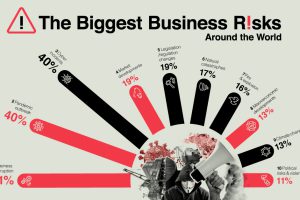
We live in an increasingly volatile world, where change is the only constant. Which are the top ten business risks to watch out for? Read more