

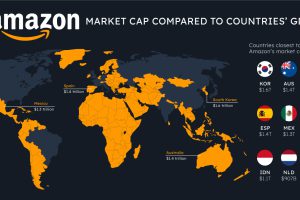
How do the big tech giants compare to entire countries? Here’s how Apple, Microsoft, and Amazon’s market caps stack up against national GDP. Read more
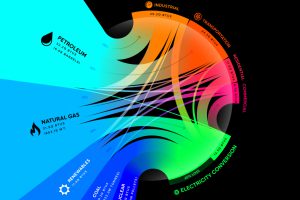
From renewables to fossil fuels, we’ve visualized the diverse mix of energy sources that powered U.S. energy consumption in 2020. Read more
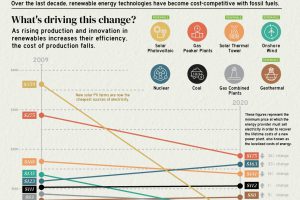
The cost of electricity from solar PV plants has decreased by 90% since 2009, highlighting the rapidly changing economics of electricity production. Read more

There are over 18 million living veterans in the U.S., but how many are ultra wealthy? This visual ranks the richest veterans in America. Read more
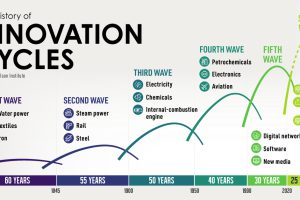
Why are innovation cycles and business growth linked so closely? We explore waves of creative destruction across history. Read more
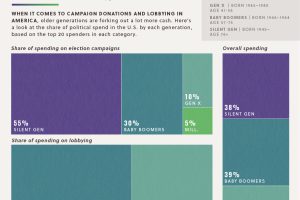
When it comes to political donations in America, the Silent Generation (age 76+) and Baby Boomers (age 57-75) fork out the most cash. Read more
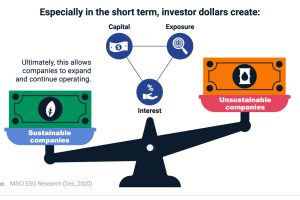
Do sustainable investments make a difference? From carbon emissions to board diversity, we break down their impact across three industries. Read more

Ranking the the world’s most powerful passports based on access to visa-free destinations. Where does your country fall on the list? Read more
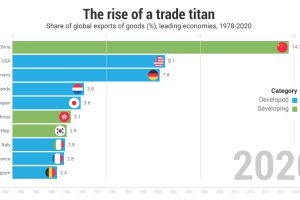
China’s economy today is completely different than 40 years ago; in 2021 the country makes up the highest share of exports globally. Read more
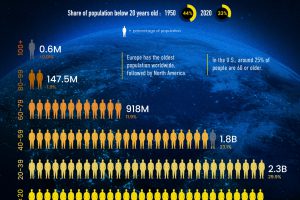
33% of the world’s population is under 20, making young people the largest demographic worldwide. But this might not be the case forever. Read more