

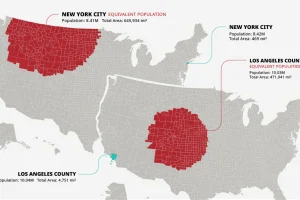
The U.S. population is spread across a huge amount of land, but its distribution is far from equal. These maps are a unique look at population density Read more
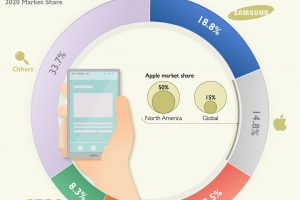
Worldwide smartphone sales decreased by 12% in 2020, but sales are expected to bounce back this year. Will Samsung remain the top dog? Read more
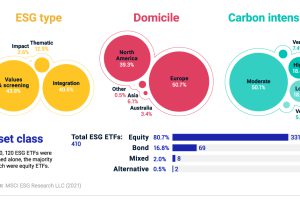
Sustainable ETFs surged to $150B in 2020—25x higher than in 2015. What makes up the sustainable ETF universe? Read more
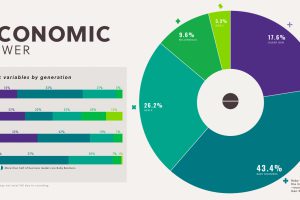
Baby Boomers hold more economic power than Gen X, Millennials, and Gen Z together. See how it all breaks down. Read more
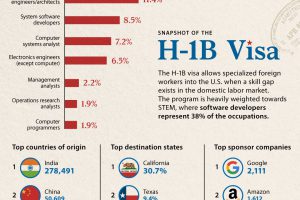
This infographic covers all the key charts and data for the H1-B visa, which grants foreign skilled workers employment in the U.S. Read more
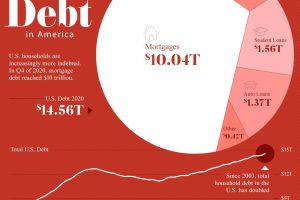
Since 2003, U.S. household debt has doubled to over $14.5 trillion. We break down the components of this colossal figure. Read more
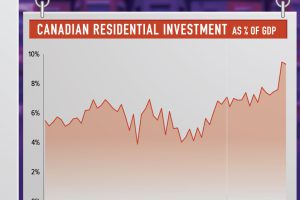
Canada’s housing market is booming. Residential real estate investment currently makes up 9.4% of the country’s GDP, more than ever before. Read more
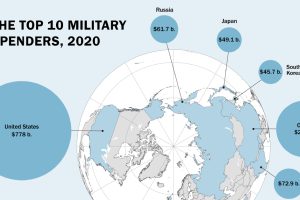
Global military spending is now at a 32-year high. We show countries’ military spending by dollars and as a portion of GDP. Read more
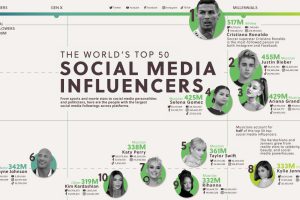
Which influencers have the most total social media followers? We tally up follower counts across all major platforms, from Twitter to TikTok. Read more
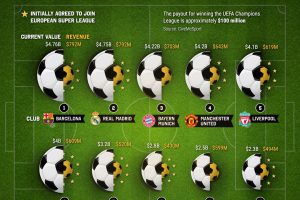
In football, there’s a lot on the line both on and off the pitch. The top 10 clubs hold a combined value of $36 billion. Read more