

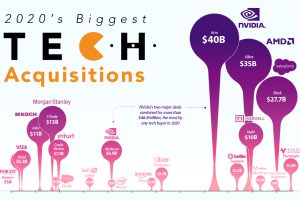
In a challenging year for most, many large tech companies have prospered and grown. We visualize the year’s biggest tech mergers and acquisitions. Read more
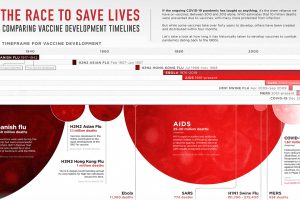
This graphic looks at how long vaccine development has historically taken for pandemics dating back to the 1900s. Read more

Visualizing the share of COVID-19 vaccines purchased by different countries and the companies that are manufacturing them. Read more
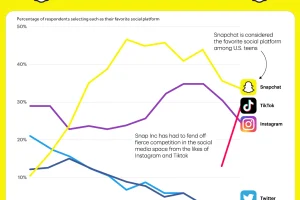
In today’s competitive social media landscape, Snapchat is #1 with American teens, but TikTok is quickly closing the gap. Read more
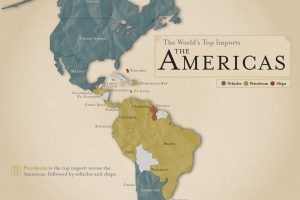
What are the most popular imports across the Americas? Petroleum is number one, followed by vehicles and ships. Read more
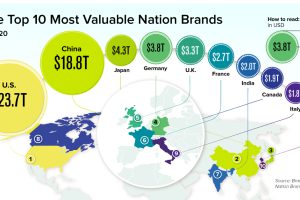
Here’s a look at the most valuable nation brands in 2020, and how the brand values of these countries have changed over time. Read more

Investor optimism regarding vaccine news and the U.S. presidential election has led to record breaking inflows into the stock market. Read more
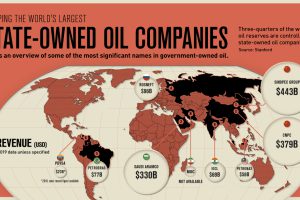
State-owned oil companies control roughly three-quarters of global oil supply. See how these companies compare in this infographic. Read more
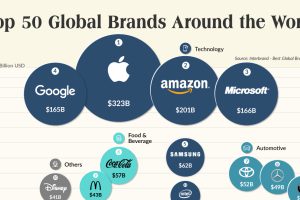
This graphic showcases 2020’s top 50 most valuable global brands and explores how COVID-19 has triggered a brand shift with huge implications. Read more
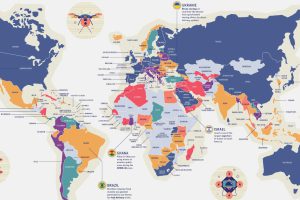
By 2025, the global commercial drone market could reach $42.8 billion. With such diverse uses, how do countries navigate drone privacy laws? Read more