

In a complex world, the combined forces of data and visual communication take on new importance. See our top 20 visualizations for 2020. Read more
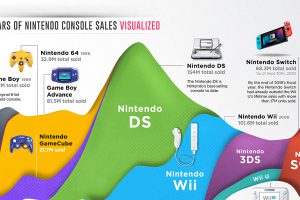
This graphic explores 20 years of Nintendo console sales and the success of the Nintendo Switch. Read more
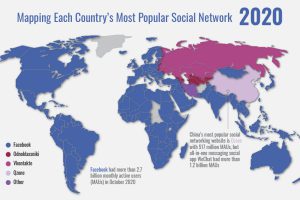
Mapping the rapid expansion of Facebook into the world’s dominant social network, and the countries and platforms resisting its growth Read more
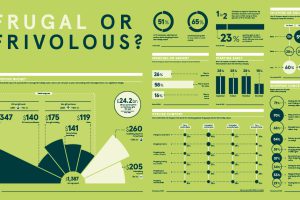
This graphic explores how festive spending in 2020 has changed as a result of the ongoing COVID-19 pandemic and evolving consumer behavior. Read more
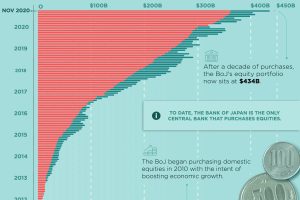
The Bank of Japan continues to be the only central bank that purchases equity securities, and it now holds $434 billion of Japanese stocks. Read more
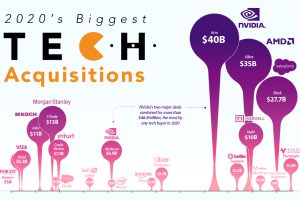
In a challenging year for most, many large tech companies have prospered and grown. We visualize the year’s biggest tech mergers and acquisitions. Read more

This graphic looks at how long vaccine development has historically taken for pandemics dating back to the 1900s. Read more

Visualizing the share of COVID-19 vaccines purchased by different countries and the companies that are manufacturing them. Read more
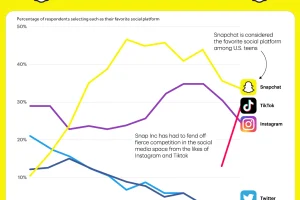
In today’s competitive social media landscape, Snapchat is #1 with American teens, but TikTok is quickly closing the gap. Read more

What are the most popular imports across the Americas? Petroleum is number one, followed by vehicles and ships. Read more