

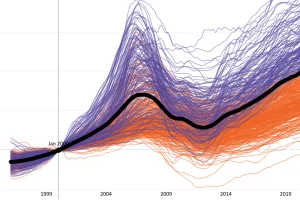
This interactive visualization tracks two decades of home price changes in hundreds of cities in the United States. Read more

Who are the leading female founders worldwide? From Brazil to Singapore, we show the global landscape of companies with women at the helm. Read more

Nearly 6,000 satellites circle our tiny planet. About 60% are space junk, 40% are operational—and hundreds more are launched every year. Read more
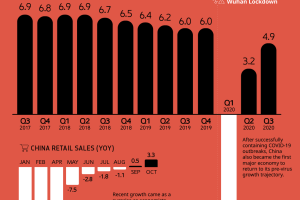
China’s economy took a massive hit in 2020 because of COVID-19, but Q2 2020 showed a speedy recovery. Here’s how the country fared in Q3. Read more

Despite the many benefits of working from home, remote workers have their own set of challenges. Here are the top struggles remote workers face. Read more
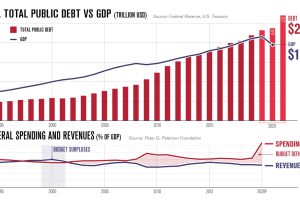
America’s debt recently surpassed $27 trillion. In this infographic, we peel back the layers to understand why it keeps on growing. Read more
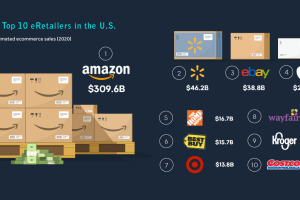
Amazon dominates the U.S. ecommerce market. By the end of 2020, the tech giant is expected to make up 39% of total U.S. ecommerce sales. Read more
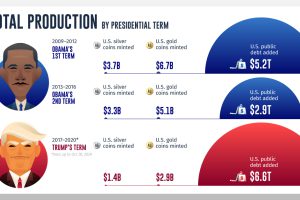
While gold and silver coin production during U.S. presidencies has declined, public debt continues to climb to historically high levels. Read more
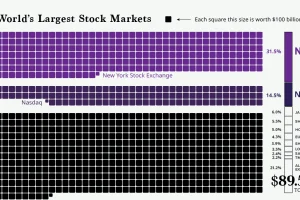
The world’s stock market exchanges have a combined market cap of $89.5 trillion, with American exchanges making up all most half that value. Read more
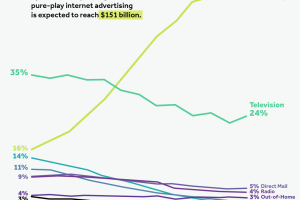
Internet advertising has shown steady growth in the last decade. By 2024, it’s projected to capture 60% of total ad spend in the United States. Read more