

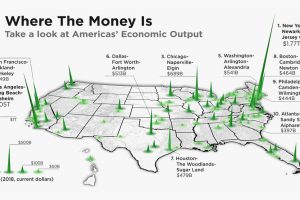
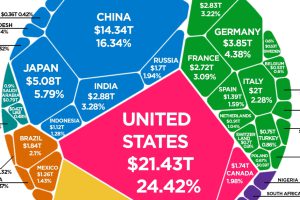
The total U.S. GDP stands at a whopping $21 trillion, but which metro areas contribute to the most in terms of economic output? Read more
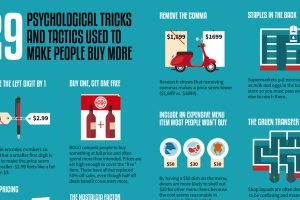
This graphic looks at 29 different psychological tricks that marketers use to try and influence consumer behavior. Read more
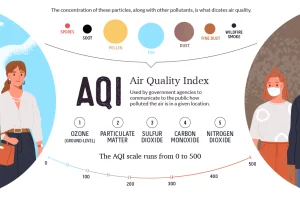
This graphic breaks down how the air quality index is measured, and looks at which regions are hardest hit by atmospheric pollution and wildfires. Read more
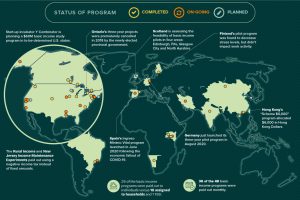
Amid the pandemic, the idea of Universal Basic Income has been gaining steam with policymakers. Where has it been tried, and has it worked? Read more
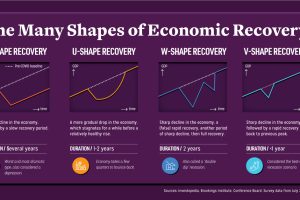
Economic recovery from COVID-19 could come in four shapes—L, U, W, and V. What do they mean, and what do global CEOs see as the most likely? Read more
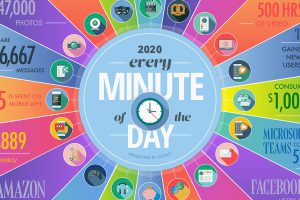
A lot can happen in an internet minute. This graphic looks at the enormous numbers behind the online services billions use every day. Read more
The world’s total GDP crested $88 trillion in 2019—but how are the current COVID-19 economic contractions affecting its future outlook? Read more
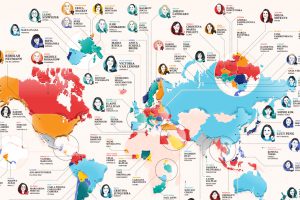
Who are the leading female founders worldwide? From Brazil to Singapore, we show the global landscape of companies with women at the helm. Read more
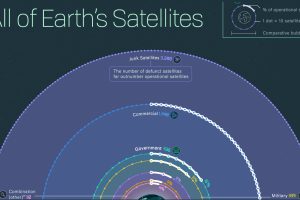
Nearly 6,000 satellites circle our tiny planet. About 60% are space junk, 40% are operational—and hundreds more are launched every year. Read more
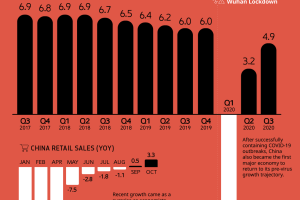
China’s economy took a massive hit in 2020 because of COVID-19, but Q2 2020 showed a speedy recovery. Here’s how the country fared in Q3. Read more