

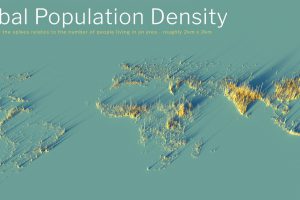
What does population density look like on a global scale? These detailed 3D renders illustrate our biggest urban areas and highlight population trends. Read more
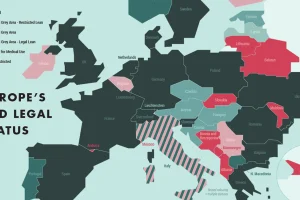
This graphic explains the innately complex legal status of CBD products in Europe and highlights the countries leading the CBD charge. Read more
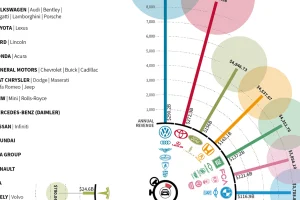
The world’s largest automakers generate a staggering amount of revenue. In fact, in the time it took you to read this, Volkswagen earned over $50,000. Read more
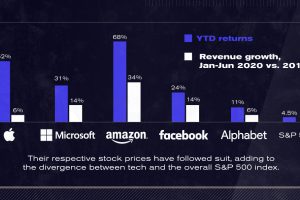
After a strong start to 2020, U.S. tech giants continue to advance to unprecedented highs. The Big Five now account for 25% of the S&P 500. Read more
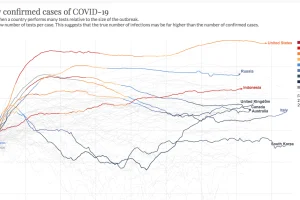
This continuously updated chart provides a more complete look at the efficacy of COVID-19 containment strategies. Read more

Picking the right VP makes all the difference to a President’s success. We look at running mates of all Presidential hopefuls since 1940. Read more
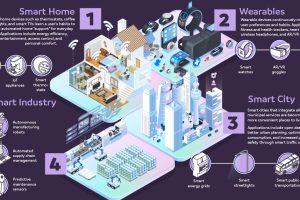
AI is emerging as a driving technology behind the internet of things (IoT). Learn about the new AIoT, and how it will impact the future. Read more
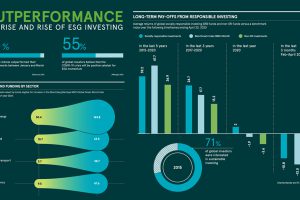
With ESG investing outperforming benchmarks, could green bonds be next in line? We unpack the megatrend taking hold of the financial world. Read more
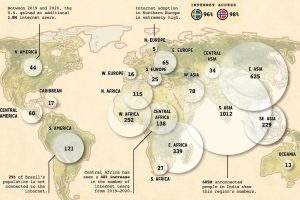
When it comes to worldwide internet use, which regions are the most disconnected? And which regions have the most opportunity for growth? Read more
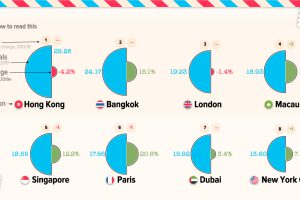
Even a pandemic can’t curb wanderlust—when tourism comes back, here are the most popular city destinations that will be seeing visitors. Read more