

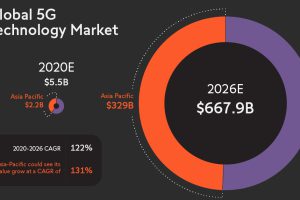
With the imminent 5G revolution, total connectivity could be at our fingertips. This graphic looks at its far-reaching IoT applications and potential. Read more
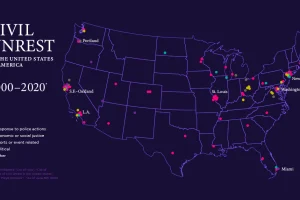
This map of civil unrest in the United States helps provide much needed context on how individual events fit within the nation-wide pattern over time. Read more
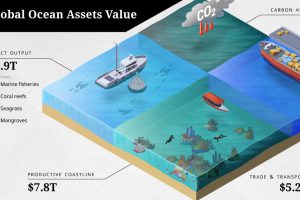
The ocean economy is under threat. How are human activities impacting the sustainable use of our ocean assets, valued at over $24 trillion? Read more
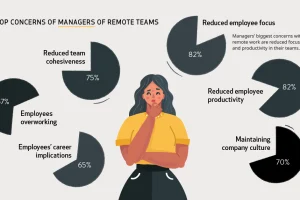
During the pandemic, millions of people have transitioned to working remotely. But how do workers and managers actually feel about it? Read more
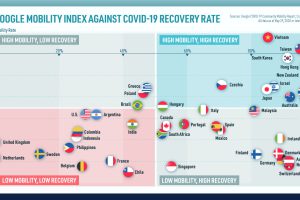
We look at mobility rates as well as COVID-19 recovery rates for 41 economies, to see which countries are reopening for business. Read more
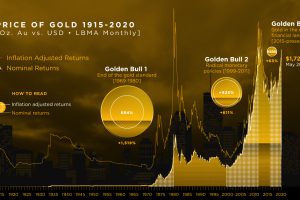
We break down gold’s three major bull markets over the last century. This includes the current one, in which gold has hit 8-year highs. Read more
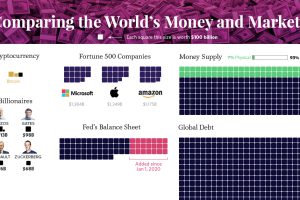
Our most famous visualization, updated for 2020 to show all global debt, wealth, money, and assets in one massive and mind-bending chart. Read more
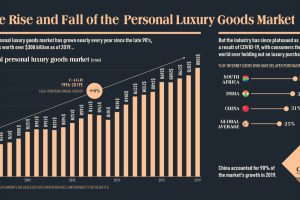
This infographic charts the rise and fall of the $308 billion global personal luxury market, and explores what the coming year holds for its growth Read more
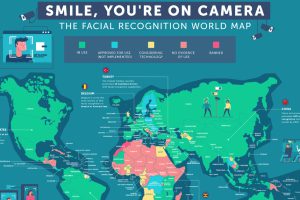
Mass surveillance is becoming the status quo. This map dives into the countries where facial recognition technology is in place, and how it’s used. Read more
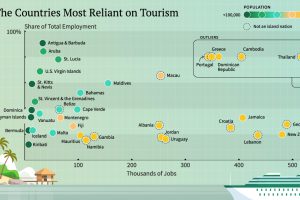
With international travel grinding to a halt, here are the economies that have the most to lose from a lack of tourism. Read more