At Risk: The U.S. Senior Population
The U.S. now has the largest number of confirmed COVID-19 cases globally, and modelling predicts that the country could see about 100,000 to 200,000 total deaths. Unfortunately, adults aged 65 or older—about 16% of the U.S. population—are at much higher risk of both severe illness and death.
Today’s chart uses U.S. Census Bureau data to map the percentage of the population that is 65 years or older by state. It also outlines the urban areas that are most heavily skewed towards this older age group.
Proportion of Seniors by State
Below is the full breakdown of the U.S. senior population by state, using the latest available data from 2018.
Maine tops the list with 20.6% of its population comprising adults age 65 or older. At the other end of the scale, Utah’s seniors make up only 11.1% of its population.
| Rank | State | 65+, % of Population | 65+, Total Population |
|---|---|---|---|
| 1 | Maine | 20.6% | 276,069 |
| 2 | Florida | 20.5% | 4,358,784 |
| 3 | West Virginia | 20.0% | 361,216 |
| 4 | Vermont | 19.8% | 123,875 |
| 5 | Montana | 18.8% | 200,239 |
| 6 | Delaware | 18.7% | 180,756 |
| 7 | Hawaii | 18.4% | 261,467 |
| 8 | Pensylvannia | 18.2% | 2,332,369 |
| 9 | New Hampshire | 18.1% | 245,156 |
| 10 | South Carolina | 17.7% | 899,754 |
| 11 | Oregon | 17.6% | 739,611 |
| 12 | Arizona | 17.6% | 1,259,103 |
| 13 | New Mexico | 17.6% | 368,480 |
| 14 | Rhode Island | 17.3% | 182,645 |
| 15 | Conneticut | 17.2% | 613,147 |
| 16 | Michigan | 17.2% | 1,720,453 |
| 17 | Ohio | 17.1% | 1,996,163 |
| 18 | Iowa | 17.0% | 537,818 |
| 19 | Wisconsin | 17.0% | 986,483 |
| 20 | Alabama | 17.0% | 829,663 |
| 21 | Missouri | 16.9% | 1,035,074 |
| 22 | Arkansas | 16.8% | 507,676 |
| 23 | Wyoming | 16.7% | 96,557 |
| 24 | South Dakota | 16.6% | 146,358 |
| 25 | Massachusetts | 16.5% | 1,137,541 |
| 26 | Kentucky | 16.4% | 731,392 |
| 27 | New York | 16.4% | 3,212,065 |
| 28 | Tennesse | 16.3% | 1,104,797 |
| 29 | North Carolina | 16.3% | 1,688,574 |
| 30 | New Jersey | 16.1% | 1,438,289 |
| 31 | Idaho | 15.9% | 279,441 |
| 32 | Kansas | 15.9% | 462,191 |
| 34 | Mississipi | 15.9% | 474,423 |
| 33 | Minnesota | 15.8% | 888,634 |
| 36 | Nebraska | 15.8% | 303,998 |
| 35 | Indiana | 15.7% | 1,051,146 |
| 37 | Nevada | 15.7% | 475,120 |
| 38 | Oklahoma | 15.7% | 619,601 |
| 39 | Illinois | 15.6% | 1,990,548 |
| 40 | Louisiana | 15.5% | 720,610 |
| 42 | Virginia | 15.5% | 1,318,225 |
| 41 | Maryland | 15.4% | 931,041 |
| 43 | Washington | 15.4% | 1,163,987 |
| 44 | North Dakota | 15.3% | 116,433 |
| 45 | California | 14.3% | 5,667,337 |
| 46 | Colorado | 14.2% | 807,855 |
| 47 | Georgia | 13.8% | 1,456,428 |
| 48 | Texas | 12.5% | 3,599,599 |
| 49 | Alaska | 11.9% | 88,000 |
| 50 | Utah | 11.1% | 351,297 |
Notably, Florida has the second highest percentage and number of seniors nationwide. Its governor just announced the state’s stay-at-home order on April 1st, after taking criticism for refusing to do so earlier.
New York, the current global hot spot of COVID-19, is close to the national average with 16.4% of its population aged 65 or older. However, with over 3.2 million seniors, the sheer volume of individuals needing hospitalization has already put a strain on the state’s healthcare system. Governor Andrew Cuomo says the state will run out of its current supply of ventilators in less than a week.
The Most Vulnerable Urban Areas
On a local level, which places have the highest proportion of seniors? Based on all urban areas* with a population of 250,000 or more, here’s how the top 50 looks:
| Rank | Urban Area | 65+, % of Population | 65+, Total Population |
|---|---|---|---|
| 1 | Bonita Springs, FL | 38.2% | 135,286 |
| 2 | Sarasota–Bradenton, FL | 33.2% | 242,613 |
| 3 | Barnstable Town, MA | 29.4% | 74,614 |
| 4 | Palm Coast–Daytona Beach–Port Orange, FL | 28.3% | 110,355 |
| 5 | Myrtle Beach–Socastee, SC–NC | 27.3% | 74,783 |
| 6 | Cape Coral, FL | 27.0% | 175,483 |
| 7 | Indio–Cathedral City, CA | 26.0% | 95,054 |
| 8 | Port St. Lucie, FL | 25.6% | 110,883 |
| 9 | Palm Bay–Melbourne, FL | 22.9% | 114,347 |
| 10 | Youngstown, OH–PA | 21.0% | 78,739 |
| 11 | Asheville, NC | 20.9% | 65,540 |
| 12 | Pittsburgh, PA | 19.6% | 335,546 |
| 13 | Canton, OH | 19.6% | 54,214 |
| 14 | Scranton, PA | 19.1% | 71,876 |
| 15 | Mission Viejo–Lake Forest–San Clemente, CA | 19.0% | 115,891 |
| 16 | Tampa–St. Petersburg, FL | 18.9% | 516,269 |
| 17 | Tucson, AZ | 18.8% | 165,399 |
| 18 | Lancaster, PA | 18.5% | 77,538 |
| 19 | Cleveland, OH | 18.4% | 324,707 |
| 20 | Miami, FL | 18.3% | 1,117,926 |
| 21 | Buffalo, NY | 18.1% | 168,121 |
| 22 | Dayton, OH | 18.0% | 130,722 |
| 23 | Harrisburg, PA | 18.0% | 83,201 |
| 24 | Wilmington, NC | 17.8% | 45,457 |
| 25 | Urban Honolulu, HI | 17.7% | 148,045 |
| 26 | Akron, OH | 17.6% | 99,010 |
| 27 | New Haven, CT | 17.6% | 97,888 |
| 28 | Rochester, NY | 17.5% | 125,516 |
| 29 | Peoria, IL | 17.5% | 44,722 |
| 30 | Allentown, PA–NJ | 17.4% | 119,508 |
| 31 | Concord, CA | 17.4% | 115,460 |
| 32 | Chattanooga, TN–GA | 17.4% | 69,098 |
| 33 | Flint, MI | 17.2% | 59,525 |
| 34 | Santa Rosa, CA | 17.1% | 55,094 |
| 35 | Lakeland, FL | 17.1% | 51,107 |
| 36 | Davenport, IA–IL | 17.1% | 48,387 |
| 37 | Providence, RI–MA | 17.0% | 204,148 |
| 38 | Rockford, IL | 16.9% | 48,370 |
| 39 | Springfield, MA–CT | 16.8% | 105,694 |
| 40 | Knoxville, TN | 16.8% | 101,332 |
| 41 | Albany–Schenectady, NY | 16.8% | 100,756 |
| 42 | Albuquerque, NM | 16.7% | 126,081 |
| 43 | Hartford, CT | 16.6% | 153,367 |
| 44 | Toledo, OH–MI | 16.6% | 82,480 |
| 45 | Pensacola, FL–AL | 16.6% | 62,216 |
| 46 | Bridgeport–Stamford, CT–NY | 16.5% | 156,035 |
| 47 | Syracuse, NY | 16.4% | 66,818 |
| 48 | Detroit, MI | 16.2% | 608,427 |
| 49 | St. Louis, MO–IL | 16.2% | 347,537 |
| 50 | Trenton, NJ | 16.2% | 47,803 |
*Urban areas consist of a downtown core and adjacent territories
With 6 areas in the top 10, Florida is quite vulnerable at the local level as well. Other states with multiple areas on the list include Ohio, Pennsylvania, and New York.
The Senior Population of Current U.S. Hotspots
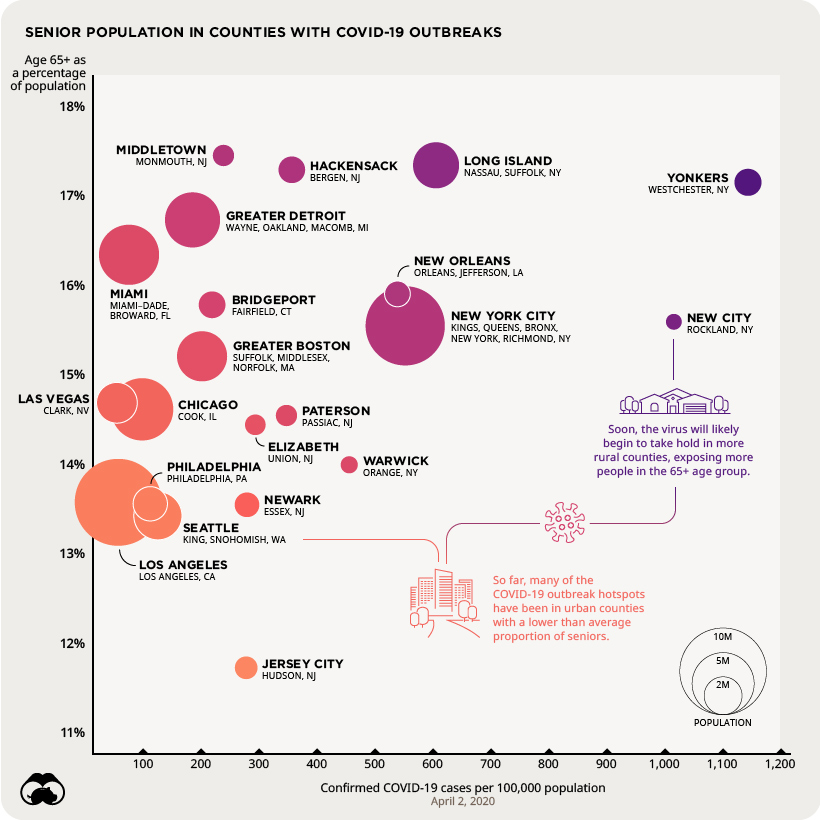
To determine the vulnerability of current COVID-19 hotspots, we compared U.S. counties with a high number of cases per capita against their percentage of seniors.
Counties at the bottom left have low readings on both metrics. Conversely, counties in the top right have a dangerous combination: a high concentration of cases and vulnerable seniors.

Multiple counties in New York occupy the top right quadrant, with Yonkers being the worst off. Los Angeles county, which has a similar population to all counties in New York City, has fewer cases and a smaller proportion of seniors.
To date, outbreaks have been mostly focused in urban areas where populations tend to be younger. However, as COVID-19 begins infiltrating rural areas, healthcare systems will need to contend with both older age groups and fewer resources.


