It’s no secret that an aging population will be the source of major demographic challenges in the coming years.
In 1975, the median age in the United States was just 28 years old. However, it’s been rising fast as the Baby Boomers age, and it’s expected to break the 40 year mark by 2030.
This shift is so fundamental that its ripples will be felt in almost every area imaginable. How we manage this change will have implications on the economy, culture, and politics – and it will almost certainly affect our personal wealth and investments, as well.
Visualizing Age in the U.S.
We’ve previously compared the population pyramids of China and India, but today we’re going to key in on the U.S. using a similar type of animation.
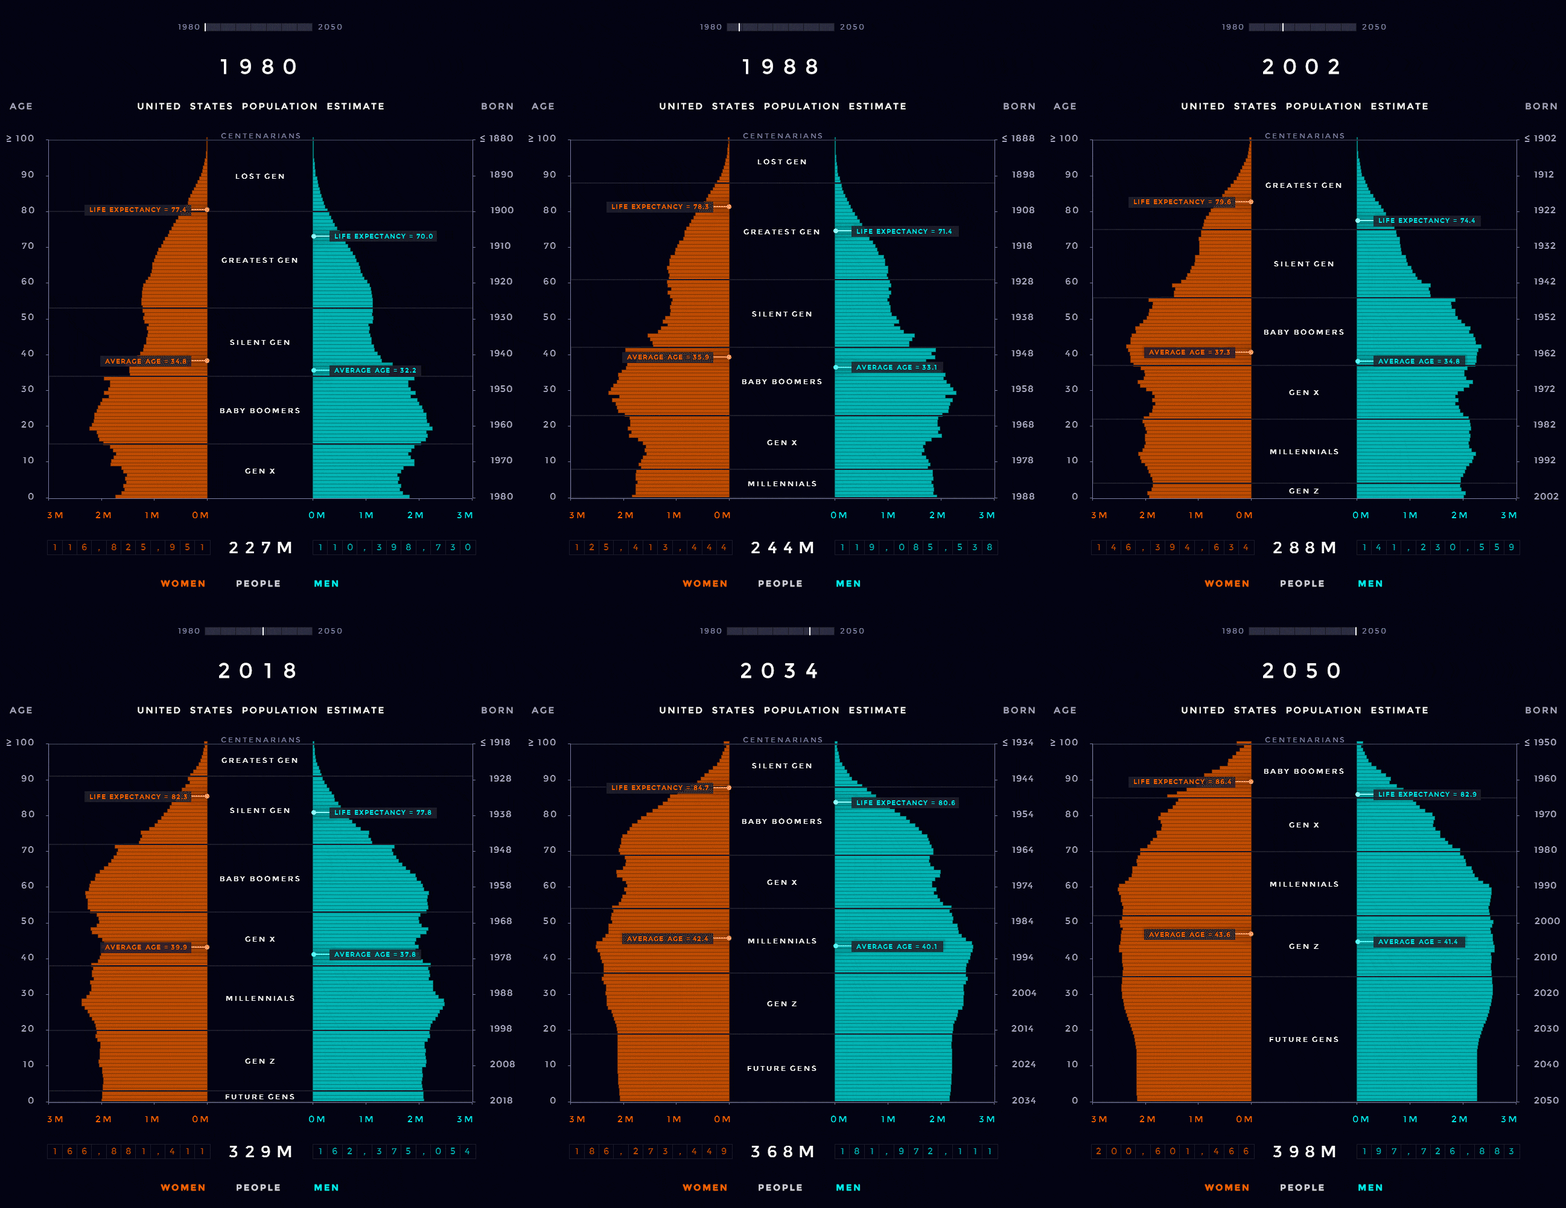
Below is an animated population pyramid that shows how the U.S. population has been shifting, including projections up until 2050 based on data from the U.S. Census Bureau and World Bank.

Credit: Reddit user milamiso
By 2050, the U.S. population will close in on 400 million people.
As with most demographic data, viewing changes in the composition of this population through a visual lens helps to provide perspective.
Aging Population
One of the biggest differences in this particular chart can be seen in the 65+ year region. In the 1980s, only a small portion of the population fits there – but by the end, it’s becoming quite crowded.
In more numerical terms – the number of Americans aged 65+ is projected to jump from 46 million today to over 98 million by 2060, and the 65+ age group’s share of the total population will rise to nearly 24%. This is mainly a function of a big generation (Baby Boomers) hitting their later years, and improved life expectancy and healthcare.
According to the Population Reference Bureau, aging Baby Boomers could mean a massive 75% increase in number of Americans requiring nursing home care, from 1.3 million in 2010 to 2.3 million in 2030.
Social Security and Medicare expenditures will also increase from 8% to 12% of GDP by 2050.
Fewer Babies
Another factor in the population equation is also lower fertility rates.
U.S. Fertility Rate (births per woman)

In the United States, the fertility rates that led to the Baby Boomer generation (born 1946-1964) have been long-gone for many decades now.
Lately, fertility has been hovering closer to 1.8 births per woman.
For reference, the replacement fertility rate is about 2.1 – meaning that without taking into account net immigration, each new generation will be smaller than the last. Unless something changes here (or with immigration policy), a more mature population will increasingly become the norm for the country.


